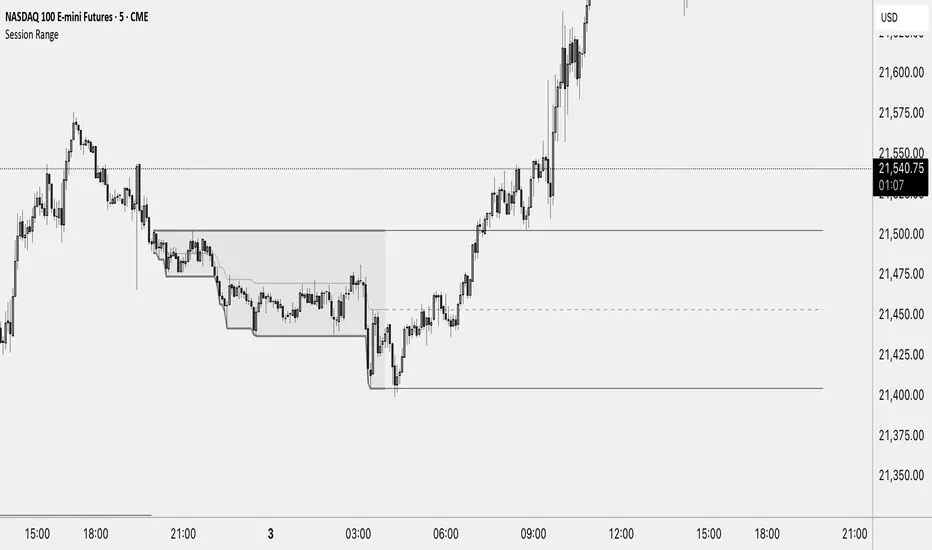
Session RangeThis Indicator Shows you the high, low and the midpoint for a chosen session and displays them on the chart.
You can make the following inputs:
Timezone: Choose your time zone (in UTC) to display the session correctly
Session Time: Choose the start time and end time of the session you want to have displayed.
Show Session Midpoint: Choose between displaying or not displaying the midpoint of the sessions high and low.
Extend Session Values until next Session: Choose this option if you want to display the sessions range until the next session starts. The midpoint will only be displayed if you chose "yes" at "Show Session Midpoint?"
Maximum number of bars between sessions: This is needed to ensure the correct display of the extended lines. Also this will affect the running speed of the script.
Limitations:
A higher number between bars slows down the script. What does that mean practically? If you choose to not have the sessions values displayed until the next session you can set this to 1 and the script will run as fast as it can. If you choose to display all the values until the next session you have to make sure that the number you put in is higher than the number of bars between the sessions. Otherwise the lines will be displayed backwards. As this affects the calculation speed you want to keep the number as low as possible. The default setting is 300 which is fine for 5 minute charts. On a 1 minute chart you will have to use something around 5000 depending on how long your session is.
Also the script will only run correctly if the start time of your session can be divided by the timeframe you are using. Example: you can use a 1min, 3min, 5min, or 15min chart on all sessions as they can only start every 15 minutes and 15 can be divided by all these numbers. A 2 minute timeframe will only work on sessions that start at minute 00 or 30, as 15 and 45 can not be divided by 2.
Customization and Alerts:
You can change the color of the sessions high, low, midpoint and background filling. The line style can also be changed but this might lead to a faulty display of the session.
The style of the extension lines can not be altered.
Alerts can be added for crossing the sessions high or low (after the session is finished). You do not have to display the extension lines in order to set an alert.
credit: The inspiration (especially for the look of this indicator) comes from the Asian Range by Nico948 indicator.
YORK
Session RangeThis Pine Script™ code is subject to the terms of the Mozilla Public License 2.0 at mozilla.org
This script plots the high and low price ranges for up to four customizable trading sessions directly on your chart. It is designed to help traders visualize price activity during specific trading hours.
Features
Customizable Sessions: Define up to four distinct trading sessions using the input.session parameter.
Visual Highlights: Each session range is highlighted with customizable colors for top and bottom lines as well as a fill between them.
Historical Ranges: Option to show historical session ranges with adjustable opacity.
Toggle Sessions: Enable or disable the display of specific trading sessions to tailor your analysis.
Overlay on Chart: The script works as an overlay, ensuring your analysis stays on the main chart.
How It Works:
Session Setup: Input the start and end times for each session in the Session 1, Session 2, Session 3, and Session 4 fields.
Dynamic Range Calculation: The script automatically calculates the high and low during active sessions, updating the range as new data comes in.
Customizable Colors: Adjust the colors for lines, fills, and historical ranges to match your charting style.
Clean Presentation: The script is designed to avoid clutter by limiting overlays to active and relevant sessions only.
Identify price action trends during key trading hours.
Compare ranges between multiple sessions for market behavior analysis.
Highlight significant session overlaps or range extensions.
Disclaimer :
This script is intended for educational purposes and should not be considered financial advice. Trading involves risks, and past performance does not guarantee future results.

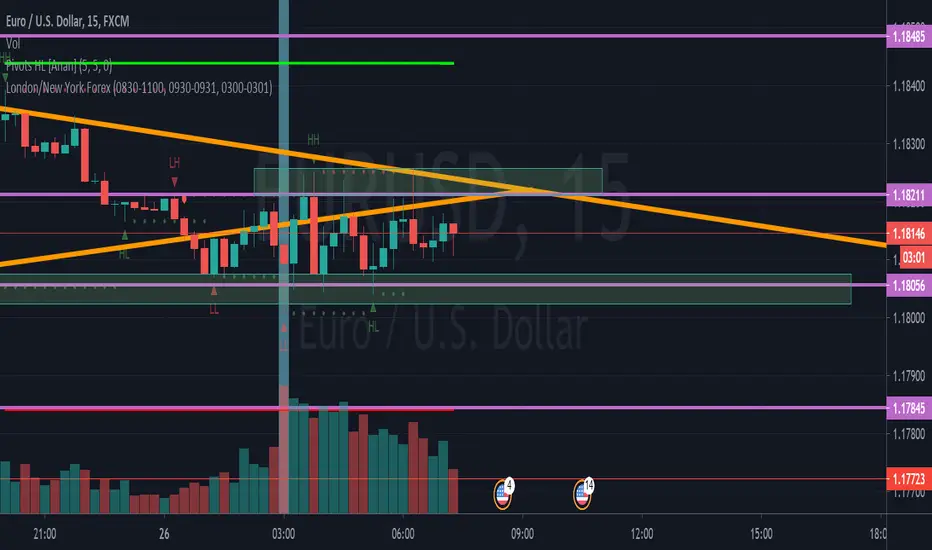
NY Killzone (Morning, Lunch, Afternoon)Indicator for New York session that splits Morning, Lunch and Afternoon part of the session.
Works on Time Frames of 30m and below.
Sessions - AlgoLabA script in UTC for London, New York, Tokyo, & Sydney sessions.
Recommended on any timeframe < 1H.
---
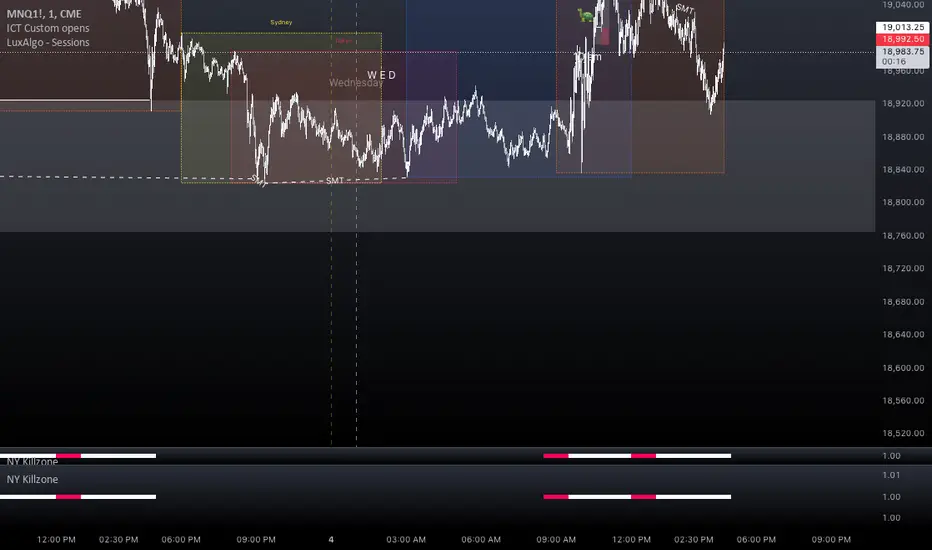
Using this script, a box is plotted on the opening candle of each session; this can show us valuable areas on each chart where price may mediate to show a standing move.
You may also select each of the session boxes, in the settings; this will show you a box of the opening, low, high, and close of each selected sessions.
Each and all boxes are closed at the end of each session.
-The script produces a time table that will show you when each session occurs, and if the current time is within one of those sessions.
---
On this chart you can see boxes formed on the opening candles of the sessions,
London is red, New York is blue, Sydney is green, Tokyo is yellow.
-A key point to notice, before using this script, is how price may mediate around each box, before causing a move.
-Some boxes may be larger / smaller than others, due to the size of the opening candle.
---
Lots of updates to come, any recommendations? Feel free to leave a comment.
Hope it helps, enjoy!

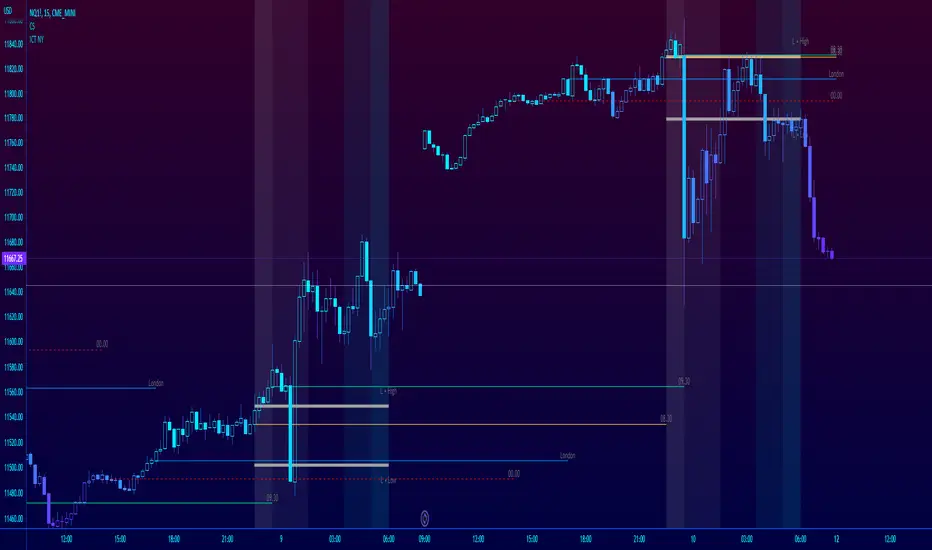
ICT NY Futures Indices Session Model - YT New York MentorshipThis indicator plots out the time periods and open lines as outlined in ICT's 2022 Mentorship and is designed specifically for the New York futures trading session.
Time zone is set to GMT-4 (NY) by default but can be changed for accommodate daylight saving in the menu.
Please note this indicator is to be used only on the 30min timeframe and below.
Here are its features:
The background color shows the morning session, in two parts (8.30am to 9.30am and 9.30am to 11.30am), then a two hour gap for lunch (ICT calls this "Dead time") and finally, the afternoon session, also to two (1.30pm to 3pm and 3pm to 4pm).
It not only shows the current killzones, but future zones as well.
These times are important; trades can be framed within these zones as taught in the mentorship.
Next are the open lines. These lines are automatically plotted and can be areas for price to react off of; they are the opening price of a candle at these times:
00.00 (New York Midnight, also known as "True Day Open")
8.30am (New York Equities pre-open)
9.30am (New York Equities open)
2.00am (London Stock Exchange open)
And lastly, London's trading session High and Low are projected forward onto the New York trading session.
These two price points are areas of liquidity that were pooled during London, but they can also often set the high or low of the day.
Please let me know if there are any bugs or if you have suggestions for the next update.
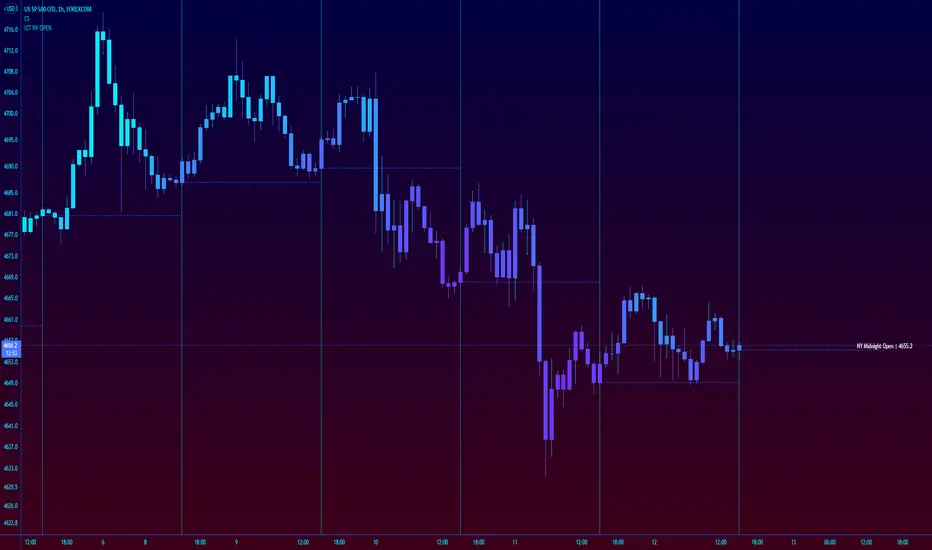
ICT New York NY Midnight Open and DividerThis simple indicator plots out ICT's New York midnight open price and a vertical divider at that time.
12am NY time is a key level to watch for daytrading and intraday scalping, often providing entry levels and orderblocks.
The session time may need to be adjusted for different exchanges, but the default is for most of forex.
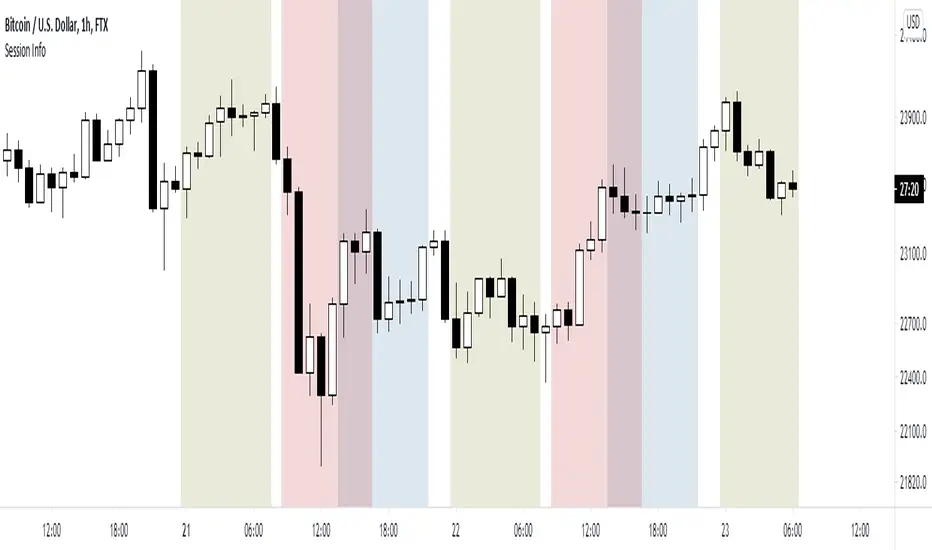
World market Session Information for bitcoinIt marks out different world markets active timings on the bitcoin charts.
You can also modify the script to a strategy and test out different strategies.