MVRV Z Score and MVRV Free Float Z-ScoreIMPORTANT: This script needs as much historic data as possible. Please run it on INDEX:BTCUSD , BNC:BLX or another chart of sufficient length.
MVRV
The MVRV (Market Value to Realised Value Ratio) simply divides bitcoins market cap by bitcoins realized market cap. This was previously impossible on Tradingview but has now been made possible thanks to Coinmetrics providing us with the realized market cap data.
In the free float version, the free float market cap is used instead of the regular market cap.
Z-Score
The MVRV Z-score divides the difference between Market cap and realized market cap by the historic standard deviation of the market cap.
Historically, this has been insanely accurate at detecting bitcoin tops and bottoms:
A Z-Score above 7 means bitcoin is vastly overpriced and at a local top.
A Z-Score below 0.1 means bitcoin is underpriced and at a local bottom.
In the free float version, the free float market cap is used instead of the regular market cap.
The Z-Score, also known as the standard score is hugely popular in a wide range of mathematical and statistical fields and is usually used to measure the number of standard deviations by which the value of a raw score is above or below the mean value of what is being observed or measured.
Credits
MVRV Z Score initially created by aweandwonder
MVRV initially created by Murad Mahmudov and David Puell
Z-score

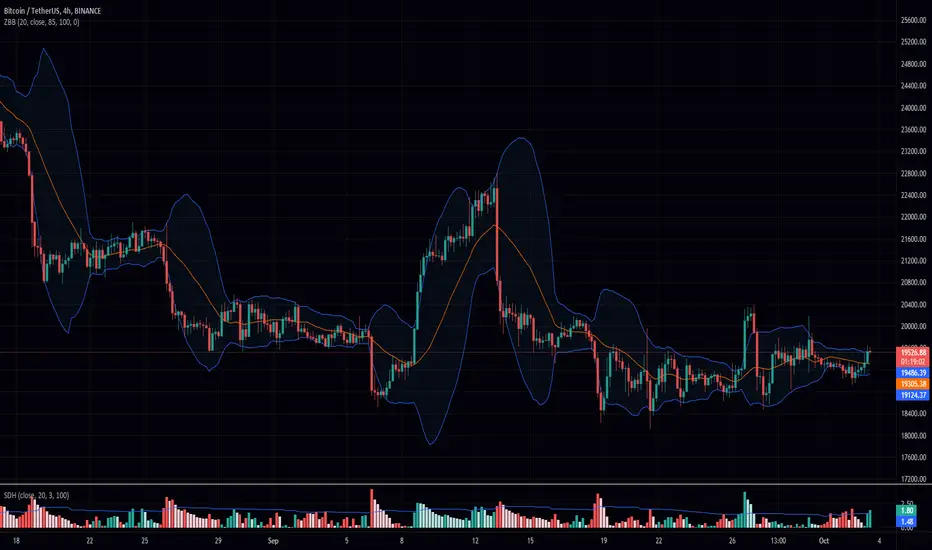
Z Bollinger BandsThis version of Bollinger Bands measures the average volatility. By taking the 75th percentile of the average absolute value of the difference between the Source and the Mean divided by the Standard Deviation and using that as our multiplier for our Bollinger bands we can have a statistically safe trading zone.
You notice that its dynamic, this is because it take into account the real volatility levels of a window and uses that to determine an appropriate multiplier. As always I hope you enjoy this release.
Improved Z-ScoreStandard Z-Score scripts lack customization of parameters that I personally desire when doing quantitative analysis. This is an improved Z-Score Indicator to add to your charts that lets you customize various inputs.
Below are the current features:
1) Ticker Type - which data would you like to use for the ticker input - Open, High, Low, Close, OHLC4
2) Ticker Smoothing? - sometimes if you have noisy data, it could be useful to smooth the ticker with a very fast EMA. If this is set to true, the ticker data will be smoothed with an EMA with period that you specify.
3) Ticker Smoothing Period - if Ticker Smoothing? is set to true, this will allow you to specify the smoothing period of the fast EMA - I usually use a 3-period for all of my quantitative analysis, if I am using smoothing.
4) MA Type - Z-Scores are normalized by subtracting a moving average. This allows you to select either a Simple Moving Average (SMA) or an Exponential Moving Average (EMA) - the standard is to use SMA.
5) MA Period - the previous X number of bars that you would like to use for normalization. The default is set to 21 (this is roughly 1 month of trading days data for a daily chart).
5) Standard Deviation Period - Z-Scores are normalized by dividing by the standard deviation over X previous periods. This allows you the chance to customize. Default is 252 (this is roughly 1 year of trading days data for a daily chart).
I can add more features if folks are interested, let me know! I hope you like the script.
Best regards,
-Jim Bosse-

[Sidders]Std. Deviation from Mean/MA (Z-score)This indicator visualizes in a straight forward way the distance price is away from the mean in absolute standard deviations (Z-score) over a certain lookback period (can be configured). Additionally I've included a moving average of the distance, the MA type can be configured in the settings.
Personally using this indicator for some of my algo mean reversion strategies. Price reaching the extreme treshold (can be configured in settings, standard is 3) could be seen as a point where price will revert to the mean.
I've included alerts for when price crosses into extreme areas, as well as alerts for when crosses back into 'normal' territory again. Both are also plotted on the indicator through background coloring/shapes.
Since I've learned so much from other developers I've decided to open source the code. Let me know if you have any ideas on how to improve, I'll see if I can implement them.
Enjoy!

Z-Score DeltaHeavily modified from Z Score by jwammo12
Compares the z-score of two assets, the onscreen one and the reference one configured. If you're familiar, you can think of it as Bollinger Band Percent of Onscreen Asset minus the Bollinger Band Percent of Reference Asset.
It's compared off a simple moving average, due to how standard deviation is calculated.
I view this a more literal meaning of relative strength.
Has the ability to offset or delay in time one to another.
TODO: add MAD and MAD/STD.DEV views
Not my greatest work, but it's functional.

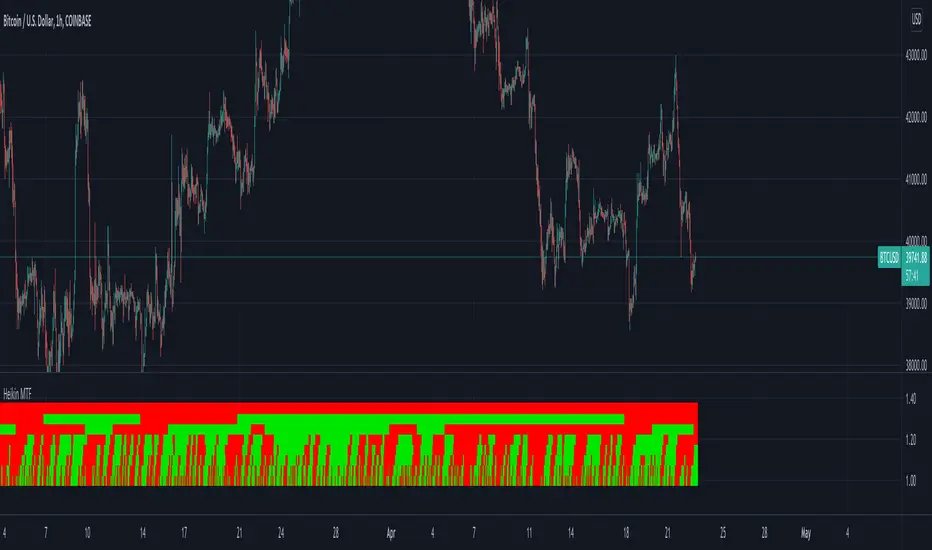
Heikin Multi Time Frame// How it Works \\
This script calculates the open and close prices of Heikin Ashi candles across multiple timeframes,
If the candle formed on that timeframe is green it will display in the table a green square, If the candle is red, the square will display red.
// Settings \\
You can change the colours of the plots
You can also Change any of the timeframes which the Heikin Ashi candles are being calculated on
// Use Case \\
Heikin Ashi candles are often used to give a smoother trend direction and help cancel out some of the noice/consolidation.
It can also be use as trend detection for multiple timeframes at once
/ / Suggestions \\
Happy for anyone to make any suggestions on changes which could improve the script,
// Terms \\
Feel free to use the script, If you do use the scrip please just tag me as I am interested to see how people are using it. Good Luck!
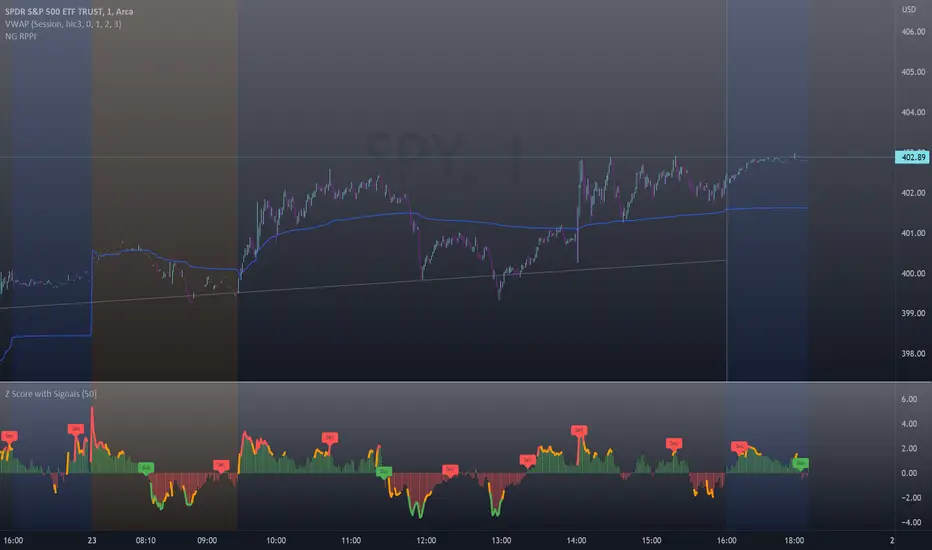
Z-Score with Buy & Sell SignalsThis is my open-source indicator of z-score with buy and sell indicators.
I see there are other z-score indicators, I just am particular about how I like my z-scores calculated and so decided to make my own and add buy and sell signals to help guide me. And I figured I could share it openly here!
What is a Z-Score
A z-score is a statistical measures of the distance, in standard deviations, a value is from its given mean. It is expressed as a standard deviation (or SD). The further a value (in this case, a stock) is from their mean, the more likely a regression to the mean is possible (i.e. a return to the average). So if a stock is trading at 3 standard deviations away from its mean, then we can anticipate it wanting to regress back towards 1 to 0 standard deviations from its mean (i.e. sell off back to a value that brings it closer to that SD).
The inverse is true if it is trading below.
Z-Scores and Stocks
Stocks, like everything in nature, like to trade between -1 and +1 SD away from its mean. Anything above this, we can interpret that there is "stress" on the stock. Anything over 2.50 is tremendous stress on the stock and we can anticipate that it will want to revert to its mean in the near future and bring that value down to at least 1, ideally between the -0.5 and 0.5 range.
Please note, I set the standard VERY high for the indicator to issue a buy and sell signal (/=2.50). Lately with the volatility, stocks have been entering these ranges frequently and so there have been plenty of signals, but traditionally in a stable environment you may not get these signals. I set the bar extremely high because I want to avoid false buy and sell signals (you will still get them though, nothing is perfect!). So the value in this indicator is in interpreting the actual z-score itself, so please be sure you understand exactly what the Z-score is (see the description above).
How the indicator works
The indicator works by calculating the average Z-Score between a stocks high and low. This indicator will present the average deviation a stock has from its high and low average. The higher the Z-Score, the more "overbought" the stock is. The lower the z-score, the more "oversold" the stock is. It uses the previous 500 candles worth of data to calculate its SMA and its Standard deviation in order to calculate the z-score.
Anytime a stock trades 2.50 SDs or more above or below its mean, you will be presented with a Buy or Sell signal, as generally, statistically speaking, after something has travelled 2.50 SDs aware from its mean, there is an increased probability of a reversion happening.
You can use this indicator to determine whether the stock is trading within normal parameters or not and to help you in your analysis as to whether or not a stock could be shorted or longed.
I personally like this for swing trading on the 1 hour chart; however, this can be used on any time from 1 minute to 1 hour. It also allows you to track a stocks progress in its reversion to the mean.
Examples of it in Use:
Gold ETF (ARCA: GLD) on 1 minute
Dow Jones ETF (ARCA: DIA) on 1 minute (my favourite Stock!)
SPY ETF (ARCA: SPY) on 1 hour chart
Disclaimer:
This is not meant to be placed as a sole and single strategy. It should be used in COJUNCTION with your other strategies to help you make a determination.
No indicator is infallible and should never be relied on 100%!
Please let me know your questions/comments/experiences/recommendations below!
Thanks everyone!
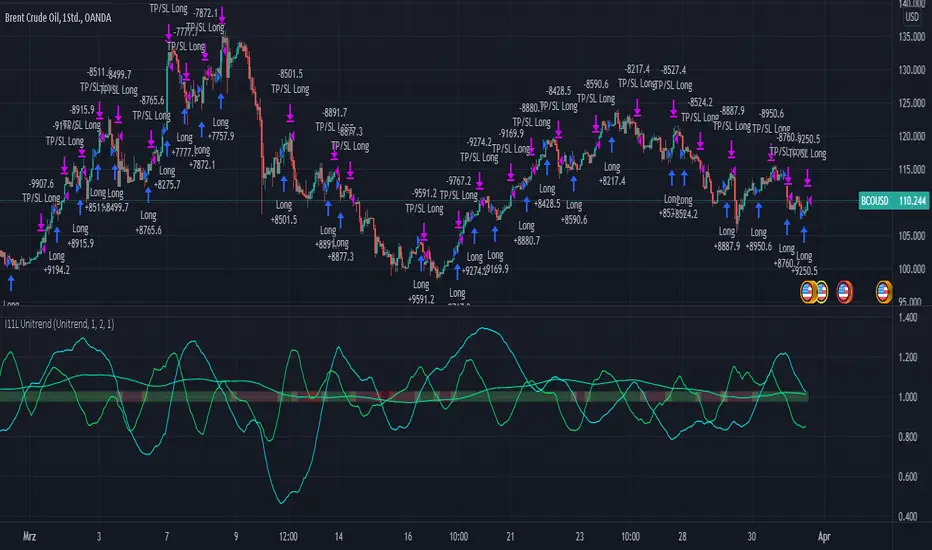
RSI, EMA, SMA Trendtrading - Oil Daytrading 1HThe Unitrend trading System produces trading recommendations on a pure Trend basis.
It is a Score based system.
--- How to use the System --
Simply adjust your capital you want to risk per trade and your TP Factor.
The TP Factor is the multiple of your risked Capital, also known as Risk/Reward ratio.
Furthermore you can toggle between a always Buy mode, to see if the System is better then market.
Compounding mode helps you to get a better understanding of your maximum drawdown with a total equity based approach.
--- How are Signals produced? ---
A score of 2 or 3 is a BUY signal.
You can count the score by looking at the lines above 1, or by reading the color.
Green is 3, yellow 2, orange 1 and red is 0.
The score is calculated by 3 conditions.
Each applying condition yields one point for the score.
The score resets each bar.
The rules are:
RSI > 45: Well known indicator, usually looks for reversal points but seems to produce above average results when above 45.
EMA(RSI) > SMA(RSI): My approach to momentum detection for the RSI movement, I consider a faster growing RSI as a good thing.
EMA(close) > SMA(close): My approach to trend detection for the market movement. Common Wisdom would be a fast SMA > slow SMA which I found to be too slow for the modern market.
Uptrend and Oversold Index Swing Trading System 8H--- Foreword ---
The Overbought and Oversold Index Swing Trading System or short: I11L Hypertrend primarily uses money management Strategies, EMA and SMA and my momentum Ideas for trying to produce satisfactory Alpha over a timespan of multiple years.
--- How does it Work? ---
It uses 20 different EMA's and SMA's to produce a score for each Bar.
It will credit one Point If the EMA is above the SMA.
A high score means that there is a strong Uptrend.
Spotting the strong Uptrend early is important.
The I11L Hypertrend System trys to spot the "UPTREND" by checking for a crossover of the Score(EMA) / Score(SMA).
A low score means that there is a strong Downtrend.
Its quite common to see a reversal to the mean after a Downtrend and spotting the bottom is important.
The System trys to spot the reversal, or "OVERSOLD" state by a crossunder of the Score(EMA) / Score(SMA).
--- What can i customize? ---
-> Trading Mode: You can choose between two different trading modes, Oversold and Overbought(trend) and Random Buys to check if your systems Profitfactor is actually better then market.
-> Work with the total equity: The system uses the initial capital per default for Backtesting purposes but seeing the maximum drawdown in a compounding mode might help!
-> Use a trailing SL: A TSL trys to not lose too much if the trade goes against your TP
-> Lookbackdistance for the Score: A higher Lookbackdistance results in a more lagging indicator. You have to find the balance between the confirmation of the Signal and the frontrunning.
-> Leverage: To see how your strategie and your maximum Drawdown with the total equity mode enabled would have performed.
-> Risk Capital per Trade unleveraged: How much the underlying asset can go against your position before the TSL hits, or the SL if no TSL is set.
-> TPFactor: Your risk/reward Ratio. If you risk 3% and you set the ratio to 1.2, you will have a TP at 3 * 1.2 = 3.6%
-> Select Date: Works best in the 8H Timeframe for CFD's. Good for getting a sense of what overfitting actually means and how easy one can fool themself, find the highest Profitfactor setting in the first Sector (Start - 2012) and then see if the second Sector (2012 - Now) produces Alpha over the Random Buy mode.
--- I have some questions about the System ---
Dear reader, please ask the question in the comment Section and i will do my best to assist you.

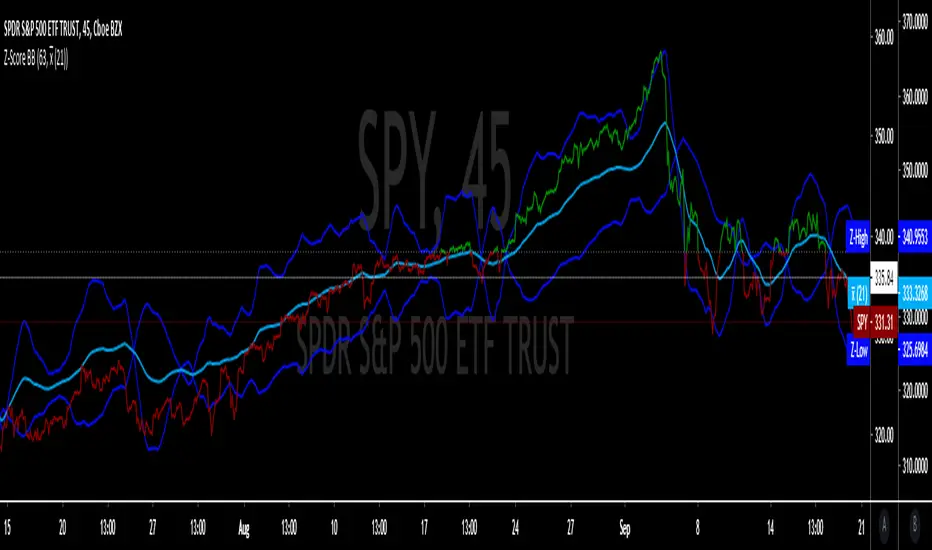
Z-Score 'Bollinger Bands'The following script is an application of the Z-Score (previous script).
Z-Scores can be used in place of standard deviation (sigma) in 'Bollinger Bands'.
The average of the sample (x-bar) over 21 days (N)
21 average trading days per month, fixed value
The average of the population (mu) over 63 days (n)
63 days per quarter, default is set to 63
Z-Score is calculated by formula in previous script, and the absolute value is taken of "Z".
Z-High = absolute value of Z + (x-bar).
Z-Low = absolute value of Z - (x-bar).
Will update with Z from mu and Z from avg (working on UX and visualization details).
Z-Score The z-score is a way of counting the number of standard deviations between a given data value and the mean of the data set.
Z-score = (x̄ - μ) / (σ / √ n)
x̄ = sample mean (using the array.avg function = array(a,close ), where i = 1 to 21)
μ = population mean ( = avg(close, n))
σ = standard deviation of the population ( = stdev(close,n))
n = number of 'close' or trading day closes
n = input
... Note: The previous indicator is part of a larger series of indicators

Z-HistogramIt is possible to approximate the underlying distribution of a random variable by using what is called an "Histogram". In order to construct an histogram one must first split the data into several intervals (also called bins) often of the same size and count the number of values falling within each intervals, the histogram plot is then constructed with the X axis representing the measured variable and the Y axis representing the frequency.
The proposed script aim to estimate the underlying distribution of a rolling z-score by constructing its histogram, here the histogram consist of 13 bins of width 0.5 rolling standard deviations. The length setting define the rolling z-score period, the window setting define the number of past data to be counted, finally using the "Total" option (true by default) will count all the rolling z-scores values since the first bar, in order to use the window setting make sure to uncheck the "Total" option.
DISPLAY
In order to see the entirety of the histogram make sure to double click on the indicator window and to have all the lower panels (text notes, pine editor...etc) hidden, finally make sure to zoom-in in order to see the frequency numbers displayed.
Z-Histogram on BTCUSD 15 min TF, the blue bins represent intervals situated over 0 while red bins represent intervals situated under 0. Here σ represent the X-axis in standard deviations, the histogram start with a bin situated at σ = -3 which count the number of times the rolling z-score was within -3 and -2.5, the histogram end with the bin situated at σ = 3 which count the number of time the rolling z-score was within 3 and 3.5.
It is also possible to look at the shape of the histogram without having the indicator window at full size.
INTERPREATION
An histogram can give really interesting information such as overall trend direction and strength. The direction can be measured by looking at the skewness of the histogram, with a negative skewness (the peak of the histogram situated at the right from the center) representing down-trending variations and positive skewness (the peak of the histogram situated at the left from the center) representing up-trending variations, while a symmetrical histogram could represent a ranging market. The farther away the peak of the histogram is situated from the center, the stronger the trend.
Another interesting characteristic is the tailedness of the histogram, which can give information about the cleanliness of the trend, for example a positive skew and high tailedness would represent a clean up-trend, as it could suggest less variations contrary to the main trend.
An histogram applied to the rolling z-score can give various useful information. As a recall the rolling z-score of the price measure the distance between the closing price and its moving average in term of rolling standard deviations, for example if the rolling z-score is equal to 2 it means that the closing price is currently 2 rolling standard deviations over its moving average.
Lets for example analyze the histogram using INTC 15 min tf with a window of 456 bars and rolling z-score of length = 100 in order to review longer term variations.
We can see from the histogram that the uptrend visible on the chart is represented by the bins situated over 0 having an overall higher frequency than the bins under 0, we can see that the closing price tended to stay between 1 and 1.5 rolling standard deviations over its period 100 moving average. Here bins under 0 accounts for retracements in the trend.
IN SUMMARY
An histogram can give various information regarding the price evolution of a security, the proposed script aim to plot the histogram of a rolling z-score. Now this script might not be too useful but it was fun to make, also it does not mean that an histogram is not an useful tool in the context of trading, the only thing required is a god implementation of it (like volume profiles for example)
In this post we have also reviewed some important statistical concepts such as distributions, z-score, skewness and tailedness, each being extremely important in the quantitative trading field.
Thx for reading !

Z Score Enhanced Time Segmented Volume (Multi MA)**THIS VERSION HAS BEEN STANDARDIZED WITH A Z SCORE CALCULATION AND ALLOWS THE USER TO SELECT WHICH MOVING AVERAGE THEY WOULD LIKE TO UTILIZE FOR THE SIGNAL LINE**
Chart shows the Non-Standardized Enhanced Time Segmented Volume (Multi MA) with default settings on top and the Standardized version with default settings on the bottom.
Time Segmented Volume was developed by Worden Brothers, Inc to be a leading indicator by comparing various time segments of both price and volume . Essentialy it is designed to measure the amount of money flowing in and out of an instrument.
Time Segmented Volume was originally ported to TradingView by user @liw0 and later corrected by user @vitelot. I never quite understood how to read Time Segmented Volume until I ran across a version by user @storma where they indicated when price would be long or short, but that code also utilized the incorrect calculation from user @liw0.
In an effort to make Time Segmented Volume more accessible and easier to read, I have re-coded it here. The calculations are based on the code from @vitelot and I have added direction indicators below the chart.
If the histogram (TSV) is greater than zero and greater than the moving average, price should be moving long and there will be a green box below the chart.
If TSV falls below the moving average while still being greater than zero, the trend may be exhausting and has been coded to read Price Action Long - FAILURE with a black x below the chart.
If the histogram (TSV) is less than zero and less than the moving average, price should be moving short and there will be a red box below the chart.
If TSV rises above the moving average while still being less than zero, the trend may be exhausting and has been coded to read Price Action Short - FAILURE with a black x below the chart.
At times, the moving average may be above zero while TSV is below zero or vice versa. In these situations the chart will indicate long or short based on whether or not TSV is greater or less than zero. It is possible a new trend may be forming as the moving average obviously lags, but also possible price is consolidating with little volume and causing TSV to oscillate close to zero.
**Z Score // Standardized Option **
Thist Standardized code implements all of the above but also allows the user to select a threshold level that should not need to be adjusted for each instrument (since the output is standardized).
If the TSV value meets the long and short signal requirements above and TSV is greater than the threshold values a green or red box will print ABOVE the oscillator. The histogram will also change color based on which threshold TSV has met.
This calculation allows us to compare current volatility to the mean (moving average) of the population (Z-Length). The closer the TSV Z-Score is to the mean, the closer it will be to the Zero Line and therefore price is likely consolidating and choppy. The farther TSV Z-Score is from the mean, the more likely price is trending.
The MA Mode determines the Moving Average used to calculate TSV itself. The Z-Score is ALWAYS calculated with a simple moving average (as that is the standard calculation for Z-Score).
The Threshold Levels are the levels at which TSV Z-Score will change from gray to yellow, orange, green ( bullish ), or red ( bearish ).
Statistically speaking, confidence levels in relation to Z-Score are noted below. The built in Threshold Levels are the positive and negative values for 90%, 95%, and 99%. This would indicate when volatility is greater than these values they are out of the ordinary from the standard range. You may wish to adjust these levels for TSV Z-Score to be more responsive to your trading needs
80% :: 1.28
85% :: 1.44
90% :: 1.64
95% :: 1.96
99% :: 2.58
The Z Length is the period for which the Z Score is calculated
More information regarding Time Segmented Volume can be found here: www.worden.com
Original code ported by @liw0
Corrected by @vitelot
Updated/Enhancements by @eylwithsteph with inspiration from @storma
Multiple MA Options Credits to @Fractured and @lejmer
Bits and Pieces from @AlexGrover, @Montyjus, and @Jiehonglim
As always, trade at your own risk.

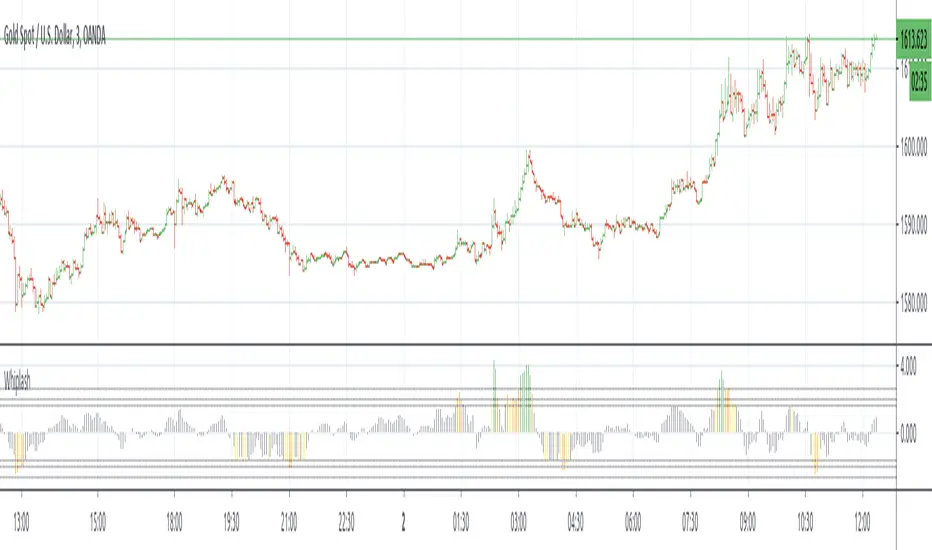
WhipLashThis is a study to determine if small candle bodies (little difference between open and close), regardless of overall candle length (high/low), can be used to filter choppy markets.
The indicator will calculate the selected average "MA Mode" of (close-open). To standardize this result and ensure any filters/thresholds do not need to be recalculated for each instrument the result will be used to calculate the Z Score.
The idea is that when candle bodies are small there is very little actual price movement, and therefore price is choppy. When considering the Z Score of that result, any outliers ie larger candle bodies, could show a potential trend forming. This indicator is similar to QStick but allows more customization by the user.
MA Mode determines which MA is used to smooth the results of (close-open)
Price Smoothing is the number of running periods the MA Mode is calculated for.
The three Thresholds are preset to the 90%, 95%, and 99% levels for Z Score. If these thresholds are altered you may wish to also alter the horizontal lines programmed for each level on the positive and negative sides.
The Z Length is the period for which the Z Score is calculated
Multiple MA Options Credits to @Fractured
Bits and Pieces from @AlexGrover, @Montyjus, and @Jiehonglim
As always, trade at your own risk.
VQZL Z-ScoreVolatility Qaulity Zero Line attempts to keep a trader out of ranging markets, but the original calculation on TradingView had to be adjusted for each instrument. To avoid this issue, I have applied a z-score calculation to the VQZL so the result is standardized for all instruments. A Z-Score is simply a value's relationship to the mean (average) of a group of values, measured in terms of standard deviations from the mean.
This calculation allows us to compare current volatility to the mean (moving average) of the population (Z-Length). The closer the VQZL Z-Score is to the mean, the closer it will be to the Zero Line and therefore price is likely consolidating and choppy. The farther VQZL Z-Score is from the mean, the more likely price is trending.
The MA Mode determines the Moving Average used to calculate VQZL itself. The Z-Score is ALWAYS calculated with a simple moving average (as that is the standard calculation for Z-Score).
The Threshold Levels are the levels at which VQZL Z-Score will change from gray to yellow, orange, green (bullish), or red (bearish). These levels can be adjusted but you should adjust the Threshold Lines as well (in the style section), so they line up with your adjusted values.
Statistically speaking, confidence levels in relation to Z-Score are noted below. The built in Threshold Levels are the positive and negative values for 90%, 95%, and 99%. This would indicate when volatility is greater than these values they are out of the ordinary from the standard range. You may wish to adjust these levels for VQZL Z-Score to be more responsive to your trading need
80% :: 1.28
85% :: 1.44
90% :: 1.64
95% :: 1.96
99% :: 2.58
As always, trade at your own risk.
VQZL Created by Investo And Adapted From @sarangab
Multiple MA Options Credits to @Fractured
Bits and Pieces from @AlexGrover and @Montyjus

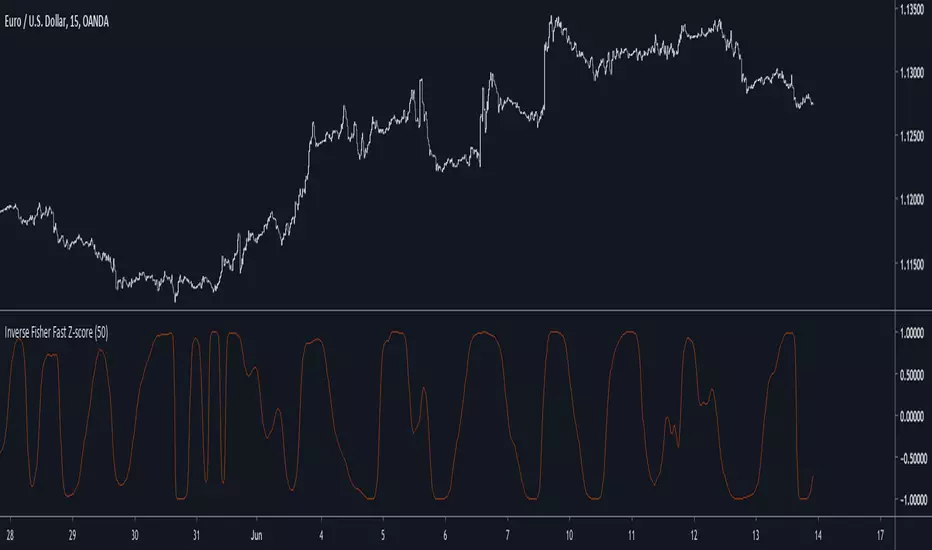
Inverse Fisher Fast Z-scoreIntroduction
The fast z-score is a modification of the classic z-score that allow for smoother and faster results by using two least squares moving averages, however oscillators of this kind can be hard to read and modifying its shape to allow a better interpretation can be an interesting thing to do.
The Indicator
I already talked about the fisher transform, this statistical transform is originally applied to the correlation coefficient, the normal transform allow to get a result similar to a smooth z-score if applied to the correlation coefficient, the inverse transform allow to take the z-score and rescale it in a range of (1,-1), therefore the inverse fisher transform of the fast z-score can rescale it in a range of (1,-1).
inverse = (exp(k*fz) - 1)/(exp(k*fz) + 1)
Here k will control the squareness of the output, an higher k will return heavy side step shapes while a lower k will preserve the smoothness of the output.
Conclusion
The fisher transform sure is useful to kinda filter visual information, it also allow to draw levels since the rescaling is in a specific range, i encourage you to use it.
Notes
During those almost 2 weeks i was even lazier and sadder than ever before, so i think its no use to leave, i also have papers to publish and i need tv for that.
Thanks for reading !
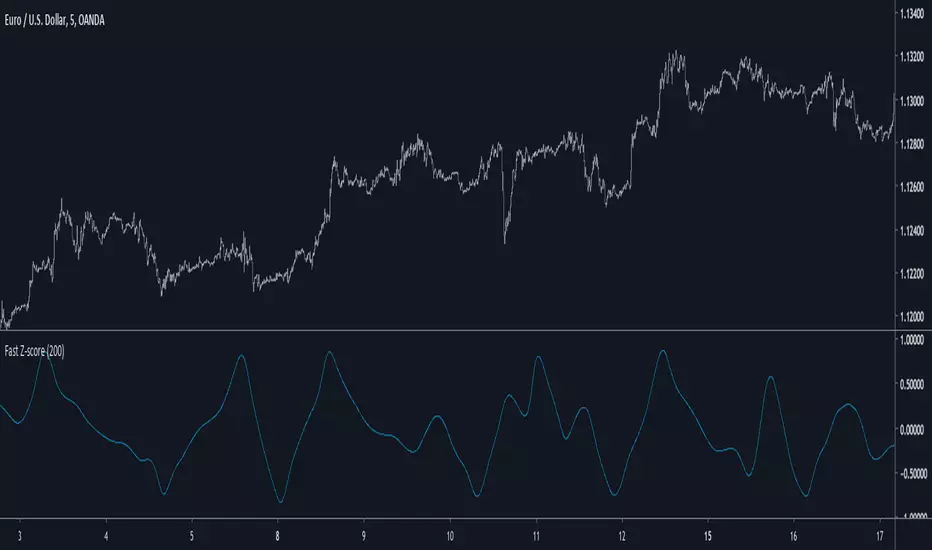
Fast Z-ScoreIntroduction
The ability of the least squares moving average to provide a great low lag filter is something i always liked, however the least squares moving average can have other uses, one of them is using it with the z-score to provide a fast smoothing oscillator.
The Indicator
The indicator aim to provide fast and smooth results. length control the smoothness.
The calculation is inspired from my sample correlation coefficient estimation described here
Instead of using the difference between a moving average of period length/2 and a moving average of period length , we use the difference between a lsma of period length/2 and a lsma of period length , this difference is then divided by the standard deviation. All those calculations use the price smoothed by a moving average as source.
The yellow version don't divide the difference by a standard deviation, you can that it is less reactive. Both version have length = 200
Conclusion
I presented a smooth and responsive version of a z-score, the result could be used to estimate an even faster lsma by using the line rescaling technique and our indicator as correlation coefficient.
Hope you like it, feel free to modify it and share your results ! :)
Notes
I have been requested a lot of indicators lately, from mt4 translations to more complex time series analysis methods, this accumulation of work made that it is impossible for me to publish those within a short period of time, also some are really complex. I apologize in advance for the inconvenience, i will try to do my best !
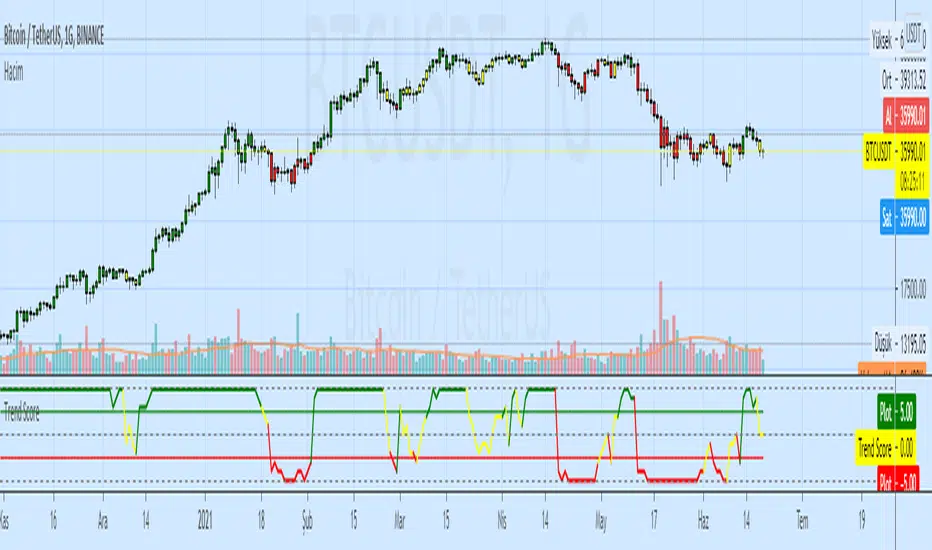
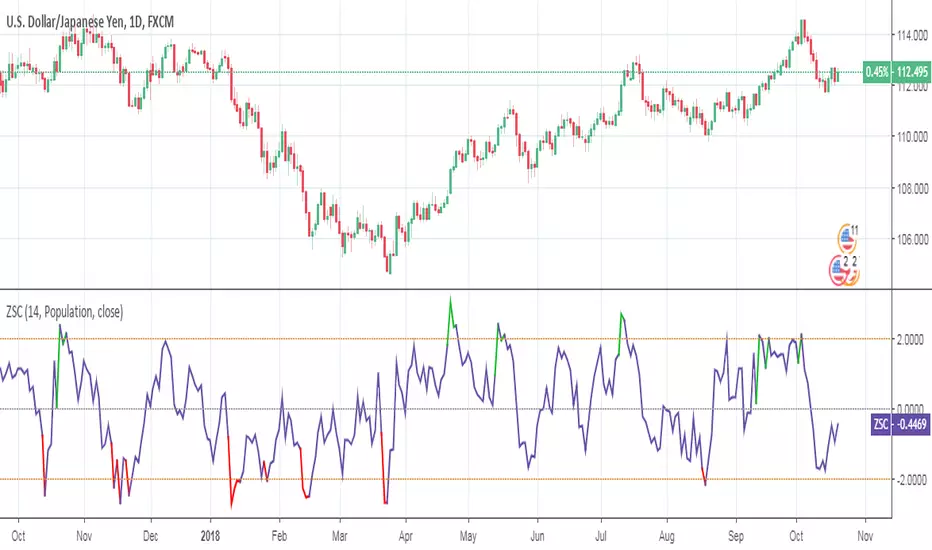
Trend Score by KIVANÇ fr3762Trend Score compares close prices between last close with previous closes by a certain period of time.
It's like momentum but gives a score +1 when close price is equal to or above (defaultly) 10 bars ago and gives a score of -1 when below.
calculation continues from default length to the 2 times of length.
Defaultly (for 10 bars length)
If Trend Score converges to 10; that means there's a strong uptrend
conversely if Trend Score converges to -10; that means a strong downtrend market is on.


Z-Score Strategy Backtest The author of this indicator is Veronique Valcu. The z-score (z) for a data
item x measures the distance (in standard deviations StdDev) and direction
of the item from its mean (U):
z = (x-StdDev) / U
A value of zero indicates that the data item x is equal to the mean U, while
positive or negative values show that the data item is above (x>U) or below
(x Values of +2 and -2 show that the data item is two standard deviations
above or below the chosen mean, respectively, and over 95.5% of all data
items are contained within these two horizontal references (see Figure 1).
We substitute x with the closing price C, the mean U with simple moving
average (SMA) of n periods (n), and StdDev with the standard deviation of
closing prices for n periods, the above formula becomes:
Z_score = (C - SMA(n)) / StdDev(C,n)
The z-score indicator is not new, but its use can be seen as a supplement to
Bollinger bands. It offers a simple way to assess the position of the price
vis-a-vis its resistance and support levels expressed by the Bollinger Bands.
In addition, crossings of z-score averages may signal the start or the end of
a tradable trend. Traders may take a step further and look for stronger signals
by identifying common crossing points of z-score, its average, and average of average.
You can change long to short in the Input Settings
Please, use it only for learning or paper trading. Do not for real trading.

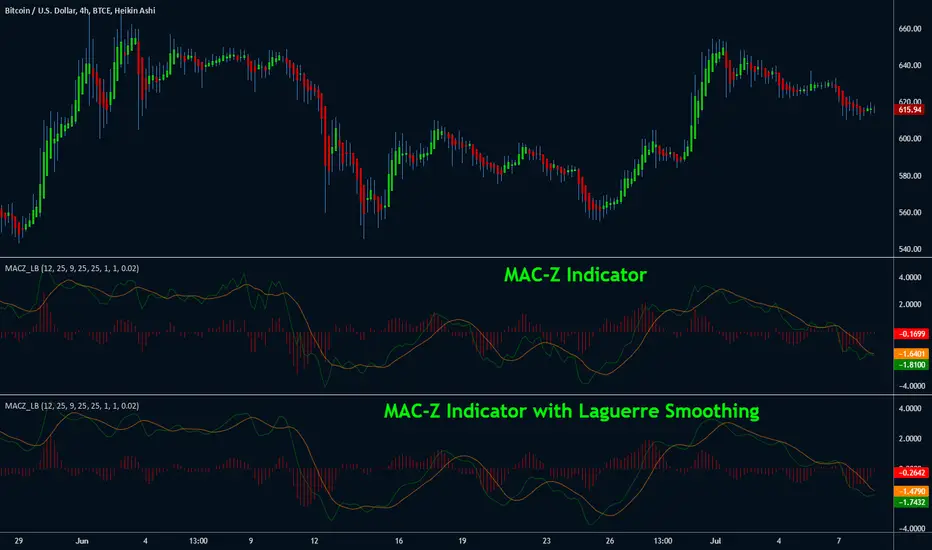
MAC-Z Indicator [LazyBear]This indicator is a composite of MACD and Z-Score (requested by @ChartAt). The general idea is that counter-trend component of the Z-score is used to adjust/improve the trend component of the MACD. The advantage is that it is a more accurate and “assumption-free” and can more accurately describe how a market or stock actually works in a given time frame.
I have also added support to smooth out the MAC-Z using Laguerre filter (Thanks @TheLark for the excellent LMA). Note that smoothing removes the "noise" component additive of Z-Score, so you may miss some good signals. By default Laguerre smoothing is OFF, I suggest playing with the Gamma to see if you can find a proper trade-off value.
Theme credits --> @liw0
More info:
cssanalytics.wordpress.com