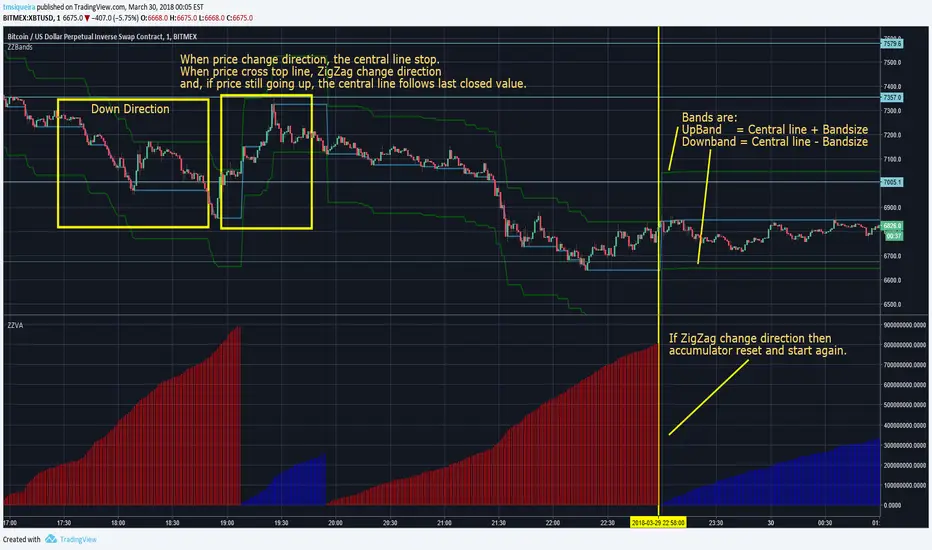
ZigZag BandsThis script plots a central line and top and bottom lines, like a bands.
If the market is up and price still going up then central line follow the last closed "close" value.
If the market is up and price goes down, then central line stop change. If price still going down and cross bottom line, the direction changes and central line start to follow the close value if it is below central line.
I recommend to use Bandsize = 2 or 3 times ATR(300 or bigger)
This script is used in pair with my ZigZag Volume Accumulator,
Indicatore Zig Zag

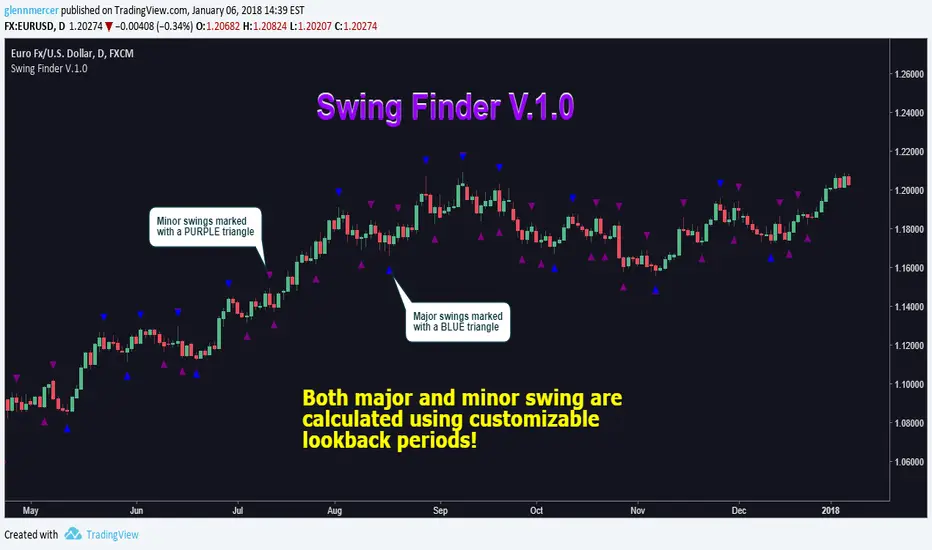
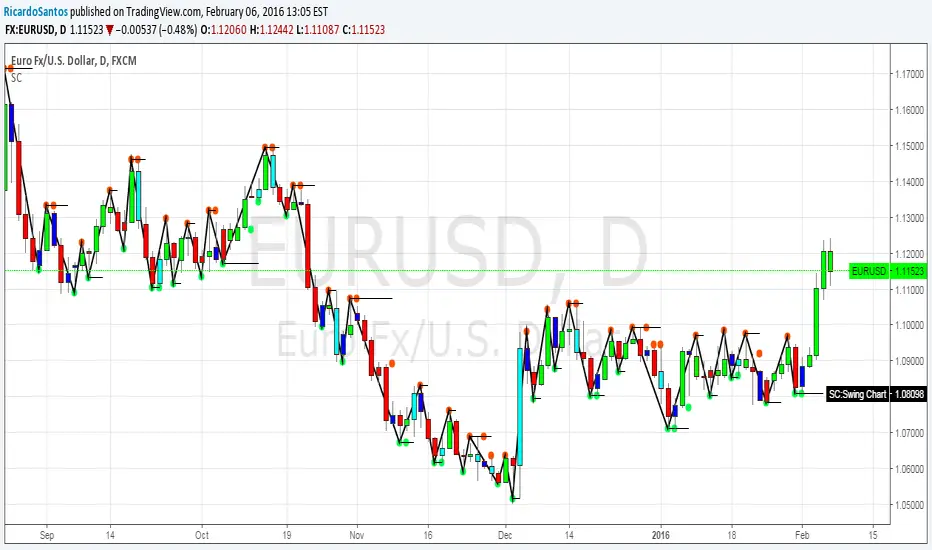
Swing Finder V.1.0Swing Finder V.1.0
Find major and minor swings
Customizable lookback periods
Great for drawing Fibonacci levels
Filter out minor retracements determined by your own parameters!!
PRO Sinewave - BETAThis is a BETA version. Which means that there might be unstability, errors...
I just decided to create this separate version of the indicator in order to let people test & give reviews before pushing the actual release to the public version.
This versions will be more "advanced" but can be less reliable.. Choose wisely !
THIS SCRIPT ACCESS WILL ONLY BE GRANTED TO SUBSCRIBED USERS... (infos on the public release) So please don't post comments to ask for unlocking !
LINK TO THE PUBLIC RELEASE
Don't forget to hit the like/follow button if you feel like my work deserves it ;)
You can check my other indicators via my TradingView's Profile : @PRO_Indicators
Bests,
Phil


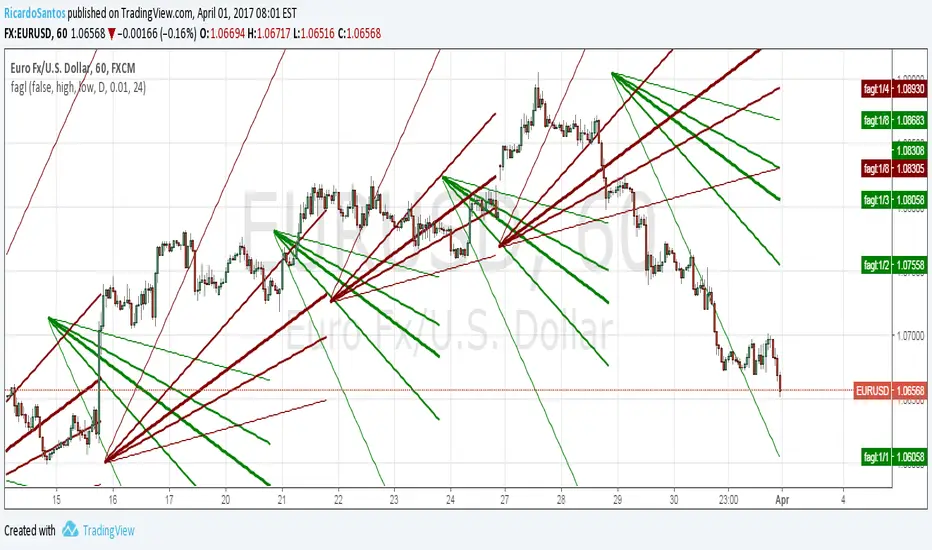
[RS]Fractal Auto Gann LinesEXPERIMENTAL:
GANN lines projection based on zigzag tops/bottoms, use at your own risk.
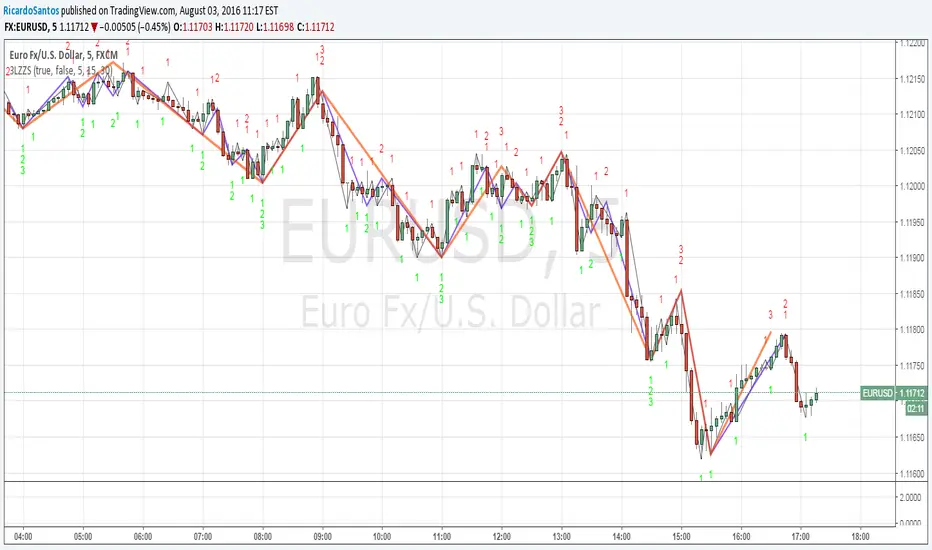
[RS]3 Level ZigZag Semafor V0EXPERIMENTAL:
request for CharanTejaM
zigzag may be adjusted to use other methods.
zigzag repaints, use at your own discretion.

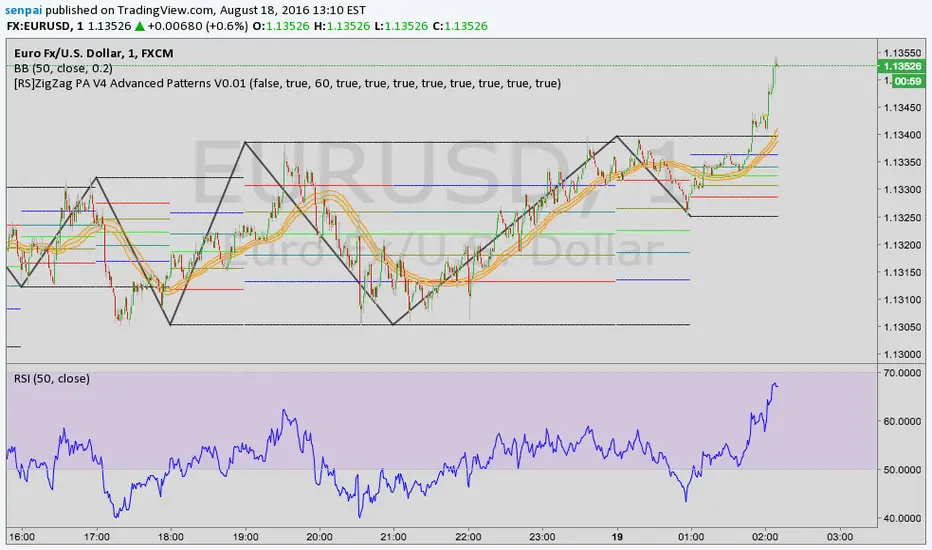
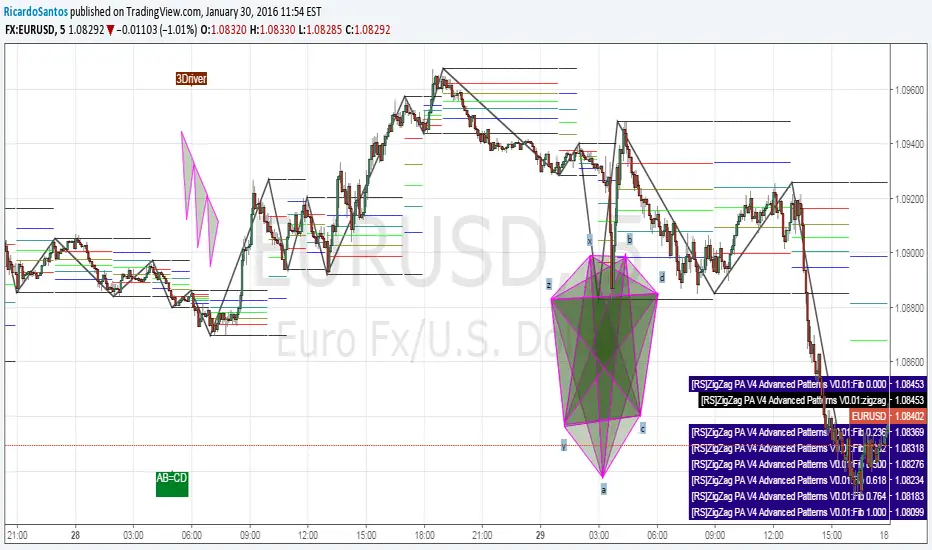
[RS]ZigZag PA V4 Advanced Patterns V0.01EXPERIMENTAL:
Method for detecting 4/5/6/7 point harmonics
included 3drive detection rates are rudimentary.

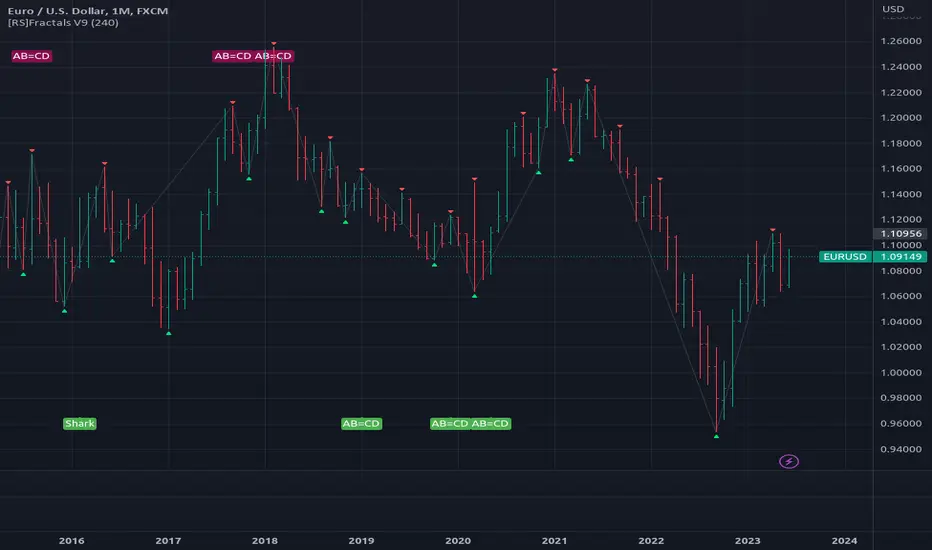
[RS]Fractals V9update: added optional option for marking the fractals with bgcolor (request for: faizal.mansor.908)
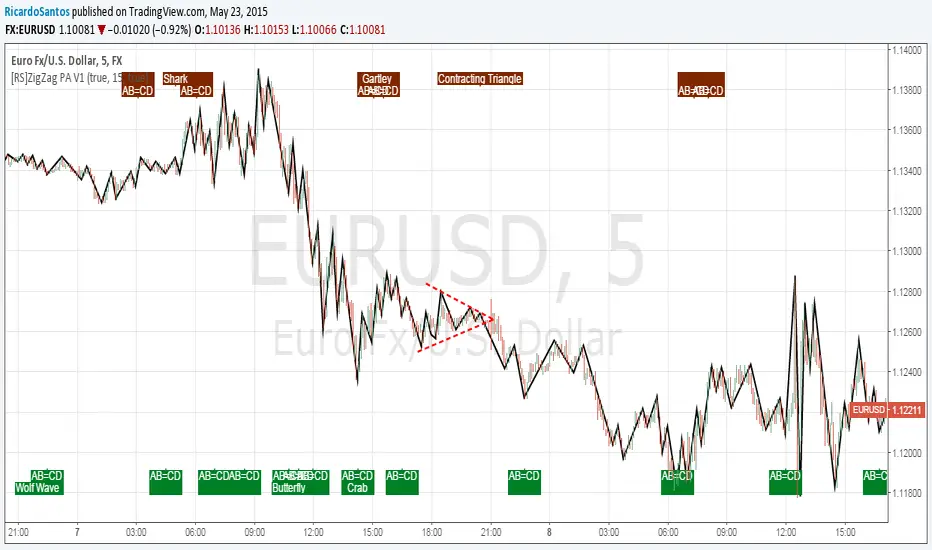
[RS]ZigZag PA V1ZigZag Based on price oscilation.
added pattern recognition, also added recognition of head and shoulders and contracting/expanding triangles to previous list of patterns :p
Use Alt Timeframe: enables optional timeframes, use higher timeframes to reduce noise.
Timeframe: said Alt Timeframe.
Show Patterns: toggles Pattern Recognition on.
[RS]Renko ZigZag V0Renko based zigzag:
mode: can be Traditional or ATR .
modeValue: can be whole number if you use ATR mode, or floating point number in case of Traditional mode.
showOverlay: displays basis Renko overlay.

[RS]ZigZag (MA, Pattern Recognition) V2EXPERIMENTAL:
Best method so far to draw the zigzag.
Multi time frame options
