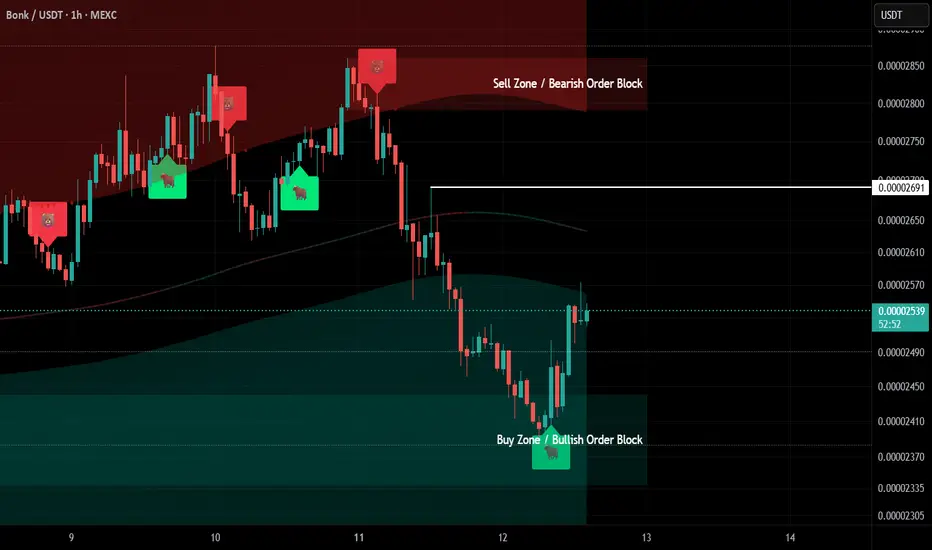
BONKUSDT - This Indicator Feels Like a Cheat CodeBeen trading BONK with my custom Buy/Sell zone indicator and the results have been insane.
It’s been catching reversals almost perfectly on the 1H chart, making entries feel effortless.
The recent buy signal nailed the bounce from the bullish order block and gave a clean move up.
Search for VIP Bul
Related pairs
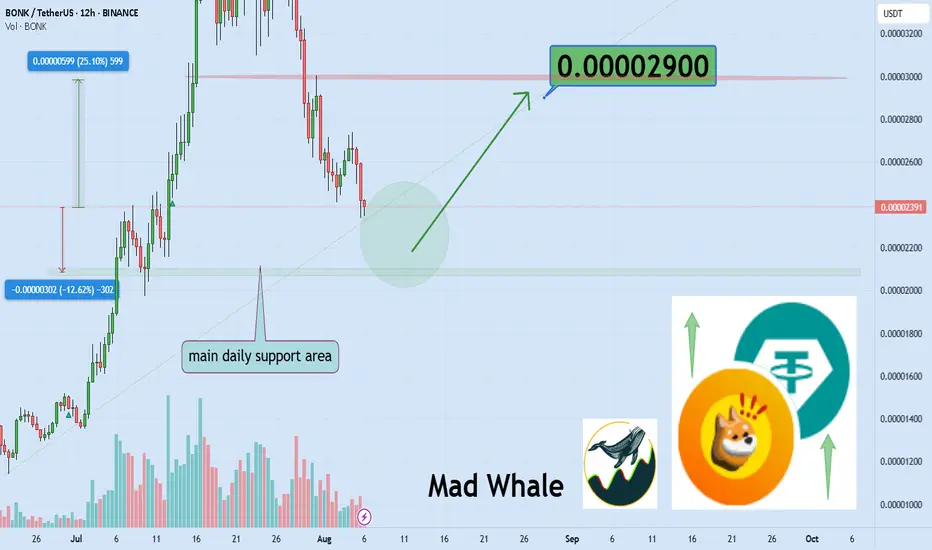
Bonk Holds Key Daily Support, Targeting 25% Rally To 0.000029Hello✌️
Let’s analyze Bonk’s price action both technically and fundamentally 📈.
🔍Fundamental analysis:
BONK's launchpad is moving $165M daily and buying back tokens with 1% fees. But yeah, with the meme coin world still shaky, BONK fell 10.3% in May’s big selloff.
If launchpad hype keeps up, it
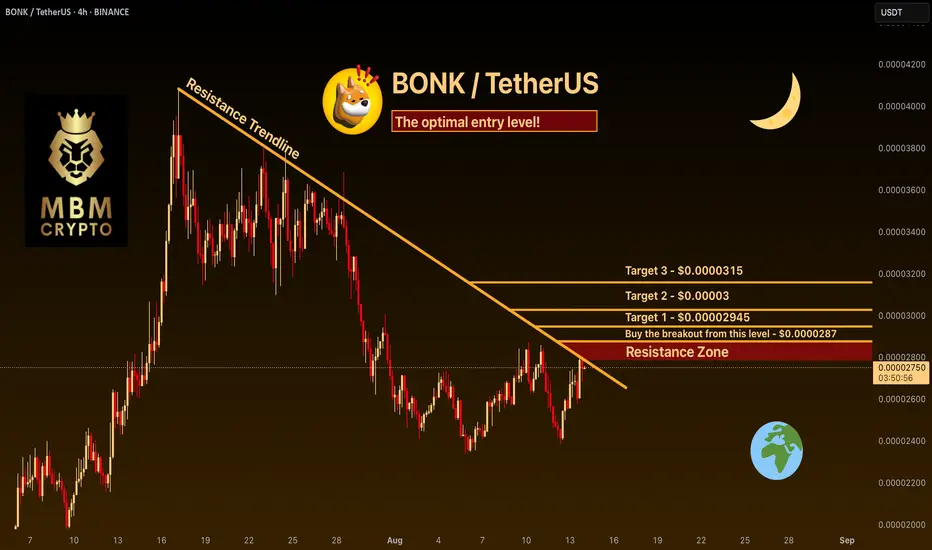
BONK: The optimal entry level! Trading Setup
If you’re considering trading BONK, here’s a quick setup that may help you.
The idea is: Buy when the price breaks above $0.0000287 and take profits at the levels shown in the chart.
Targets:
1. $0.00002945
2. $0.00003
3. $0.0000315
-------------------------------------------
BONKUSDT stuck in a boring range breakout is needed Market here is not that much exciting now and it get stuck between two major Trendline and from breakout to the upside we are +50% far away and i think in this bull run that breakout may not happen even and we may only see that rise again to red trendline and after that more range and dump.
But onl
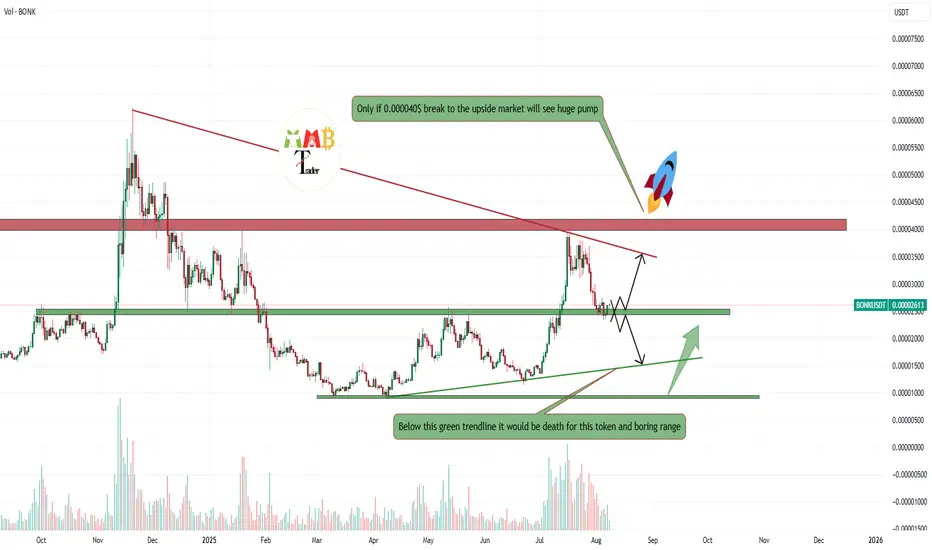
600 Days of Consolidation — $BONK Finally Wakes UpCRYPTOCAP:BONK has been consolidating inside a wide range for over 600 days. Price recently broke above a short-term downtrend line, showing renewed bullish momentum.
Holding above the mid S/R zone could trigger a move toward the range highs, while a drop back below may send it toward the lower ra

Bonk pump to $0.0000274 tonightJust now hopped into bonk long. Time sensitive
Aiming for $0.0000274
Sl: 0.000025866
2RR+

#BONK/USDT About to Break Out !#BONK
The price is moving within a descending channel on the 1-hour frame and is expected to break and continue upward.
We have a trend to stabilize above the 100 moving average once again.
We have a downtrend on the RSI indicator that supports the upward break.
We have a support area at the low

BONKUSDT – Let the Market Come to YouIn a possible Q3 correction, BONKUSDT may retest the green box zones below.
These areas are not predictions — they’re prepared zones where I’ll be waiting, not chasing.
🟩 I don’t buy strength blindly. I buy value with structure.
All risk-on markets typically experience significant corrections in t

Bonk short to $0.02585Opened a short position on bonk just now. Aiming for 0.02585
Sl: $0.028185 or higher
Roughly 2RR
DTT strategy used - Learn more on X

BONK Setup – Watching for Retracement After 200%+ RallyBONK has surged over 200% in recent weeks. We're now eyeing a retracement to a key support zone that could offer a prime entry for the next leg higher.
📌 Trade Setup:
• Entry Zone: $0.00002240 – $0.00002500
• Take Profit Targets:
o 🥇 $0.00004050 – $0.00004800
o 🥈 $0.00005500 – $0.00006500
• Stop

See all ideas
Summarizing what the indicators are suggesting.
Oscillators
Neutral
SellBuy
Strong sellStrong buy
Strong sellSellNeutralBuyStrong buy
Oscillators
Neutral
SellBuy
Strong sellStrong buy
Strong sellSellNeutralBuyStrong buy
Summary
Neutral
SellBuy
Strong sellStrong buy
Strong sellSellNeutralBuyStrong buy
Summary
Neutral
SellBuy
Strong sellStrong buy
Strong sellSellNeutralBuyStrong buy
Summary
Neutral
SellBuy
Strong sellStrong buy
Strong sellSellNeutralBuyStrong buy
Moving Averages
Neutral
SellBuy
Strong sellStrong buy
Strong sellSellNeutralBuyStrong buy
Moving Averages
Neutral
SellBuy
Strong sellStrong buy
Strong sellSellNeutralBuyStrong buy
Displays a symbol's price movements over previous years to identify recurring trends.
Frequently Asked Questions
The current price of BONK / TETHER (BONK) is 0.0000229422 USDT — it has fallen −3.77% in the past 24 hours. Try placing this info into the context by checking out what coins are also gaining and losing at the moment and seeing BONK price chart.
BONK / TETHER price has fallen by −11.98% over the last week, its month performance shows a −22.58% decrease, and as for the last year, BONK / TETHER has increased by 19.59%. See more dynamics on BONK price chart.
Keep track of coins' changes with our Crypto Coins Heatmap.
Keep track of coins' changes with our Crypto Coins Heatmap.
BONK / TETHER (BONK) reached its highest price on Nov 20, 2024 — it amounted to 0.0000615900 USDT. Find more insights on the BONK price chart.
See the list of crypto gainers and choose what best fits your strategy.
See the list of crypto gainers and choose what best fits your strategy.
BONK / TETHER (BONK) reached the lowest price of 0.0000001757 USDT on Oct 12, 2023. View more BONK / TETHER dynamics on the price chart.
See the list of crypto losers to find unexpected opportunities.
See the list of crypto losers to find unexpected opportunities.
The safest choice when buying BONK is to go to a well-known crypto exchange. Some of the popular names are Binance, Coinbase, Kraken. But you'll have to find a reliable broker and create an account first. You can trade BONK right from TradingView charts — just choose a broker and connect to your account.
Crypto markets are famous for their volatility, so one should study all the available stats before adding crypto assets to their portfolio. Very often it's technical analysis that comes in handy. We prepared technical ratings for BONK / TETHER (BONK): today its technical analysis shows the sell signal, and according to the 1 week rating BONK shows the buy signal. And you'd better dig deeper and study 1 month rating too — it's buy. Find inspiration in BONK / TETHER trading ideas and keep track of what's moving crypto markets with our crypto news feed.
BONK / TETHER (BONK) is just as reliable as any other crypto asset — this corner of the world market is highly volatile. Today, for instance, BONK / TETHER is estimated as 9.47% volatile. The only thing it means is that you must prepare and examine all available information before making a decision. And if you're not sure about BONK / TETHER, you can find more inspiration in our curated watchlists.
You can discuss BONK / TETHER (BONK) with other users in our public chats, Minds or in the comments to Ideas.