La chiave per capire se Bitcoin riuscirà a superare quota 111K.
Il prezzo di Bitcoin ha chiuso a 108.199 dollari il 5 luglio 2025, con l'asset che ha oscillato in un intervallo intraday ristretto tra 107.386 e 109.117 dollari. Ora, con una capitalizzazione di mercato di 2.151 miliardi di dollari e un volume di scambi di 24 ore di 2.1145 miliardi di dollari, Bitcoin continua a consolidarsi al di sotto dei livelli di resistenza chiave senza un chiaro momentum direzionale.
Il grafico a 4 ore di BTC/USD mostra una cauta prospettiva rialzista dopo un breakout da 105.130 dollari a un recente massimo di 110.557 dollari, seguito da un pullback sotto una forte pressione di vendita. La struttura dei prezzi del grafico riflette minimi crescenti, ma anche massimi decrescenti di breve termine, un segno di un nuovo consolidamento. I supporti chiave di 107.800 e 106.300 dollari sono molto importanti per lo swing trading. Un pattern candlestick rialzista confermato, come un martello o un pattern engulfing vicino a $ 108.000, potrebbe offrire un profilo rischio-rendimento favorevole che punta a una resistenza vicino a $ 110.000. I trader dovrebbero diffidare di divergenze ribassiste sull'indice di forza relativa (RSI) o di un mancato recupero prolungato dei massimi precedenti.
Da una prospettiva giornaliera, Bitcoin si trova in un range che ha raggiunto un massimo di $ 110.587 e un minimo di $ 98.240, con un recente rimbalzo verso la zona dei $ 108.000. Questo movimento simmetrico forma un potenziale doppio massimo, con un'impennata di volume nel trend ribassista che mostra un pattern di distribuzione. Il range tra $ 98.000 e $ 110.000 definisce l'attuale configurazione macro, con una compressione in atto. Gli investitori dovrebbero attendere la conferma quando cercano un ingresso a lungo termine: una forte rottura al rialzo sopra i 111.000 dollari confermerebbe una continuazione rialzista, mentre una rottura sotto i 98.000 dollari segnalerebbe un'inversione ribassista.
Se Bitcoin supera i 109.000 dollari con forza e conferma un continuo breakout rialzista sopra i 111.000 dollari con volumi elevati, il trend più ampio favorirà una ripresa di nuovi massimi. L'allineamento dei segnali di acquisto su tutte le principali medie mobili e un MACD di supporto rafforzano lo slancio rialzista, con un ulteriore potenziale di rialzo che probabilmente si materializzerà nel breve-medio termine.
Se Bitcoin non riuscisse a mantenersi sopra i 108.000 dollari e scendesse al di sotto del livello di supporto critico dei 107.300 dollari, ciò confermerebbe un'inversione ribassista all'interno del range stabilito. Le condizioni di ipercomprato dell'oscillatore e la forte pressione di vendita derivante dai recenti massimi suggeriscono che il mercato potrebbe prepararsi a una correzione più profonda, con obiettivi di ribasso che si aprono nella fascia dei 100.000 dollari e oltre.
Idee di trading

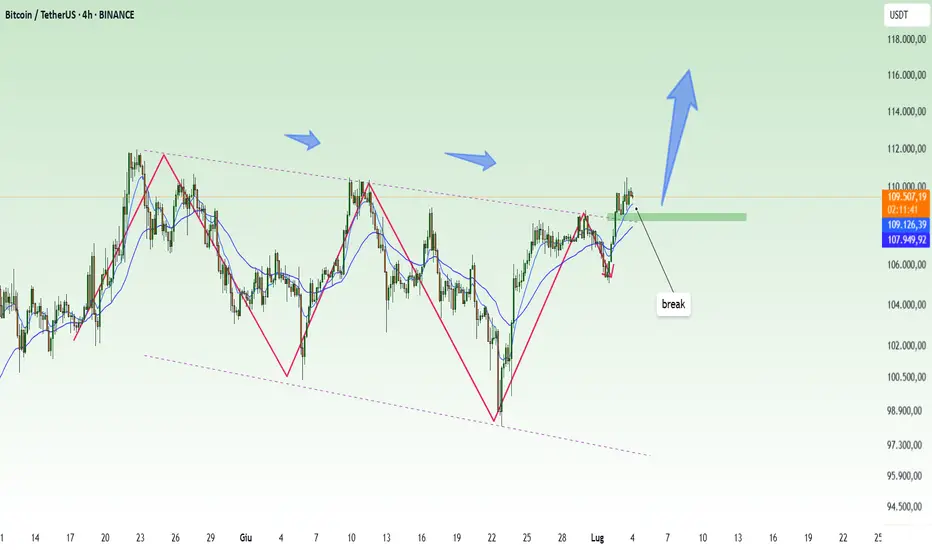
BTC rimbalzaNonostante la bassa volatilità tipica del weekend che il prezzo sta attualmente attraversando, si può notare che il BTC rimane comunque rialzista. Dopo il pullback quando il prezzo ha toccato i 110.000, si osserva un rimbalzo sulla candela con stoppino che ha sostituito le FVG, come menzionato ieri prima che il prezzo la toccasse. La formazione di una reazione rialzista accompagnata da un martello rialzista fa pensare che gli acquirenti stiano ancora sostenendo il mercato e che il prezzo voglia rompere i 110.000. Inoltre, il prezzo ha formato in zona 110.000 due equal highs, lasciando una grande quantità di liquidità, poiché molti venditori hanno posizionato i loro stop loss appena sopra.
Bitcoin punta a 110.000!
Gli indicatori di momentum e le medie mobili su tutti i timeframe sono perfettamente allineati, indicando una solida struttura rialzista per i fondamentali di Bitcoin. Se il prezzo conferma una chiusura intraday sopra i 108.500 dollari e viene confermato dal volume, una spinta verso i 110.000 dollari o più è possibile nel breve termine.
Questo non è un obiettivo lontano: Bitcoin è sceso da questa posizione, il che è un trend normale!

Pausa, BTC raggiungerà presto un nuovo massimo storico.Aggiornamento del piano BTC dopo l'NFP
Notizie importanti su BTC:
Bitcoin (BTC) ha recuperato a $ 109.000 mercoledì, quando l'accordo tra Stati Uniti e Vietnam e l'aumento dell'offerta globale di moneta M2 hanno favorito un aumento dei tassi di interesse aperti (OI), che sono saliti a 689.780 BTC, per un valore di circa $ 75 miliardi. Il mercato delle criptovalute in generale ha registrato un aumento di prezzo insieme a BTC, con le principali altcoin, Ethereum (ETH), XRP e Solana (SOL), che sono aumentate rispettivamente del 7%, 3% e 4%.
Bitcoin, il mercato delle criptovalute, è cresciuto grazie all'accordo commerciale con il Vietnam e all'impennata dell'offerta di moneta M2.
Il mercato delle criptovalute ha recuperato mercoledì, con un aumento del 2%, riconquistando la capitalizzazione di mercato di $ 3.500 miliardi.
Analisi tecnica
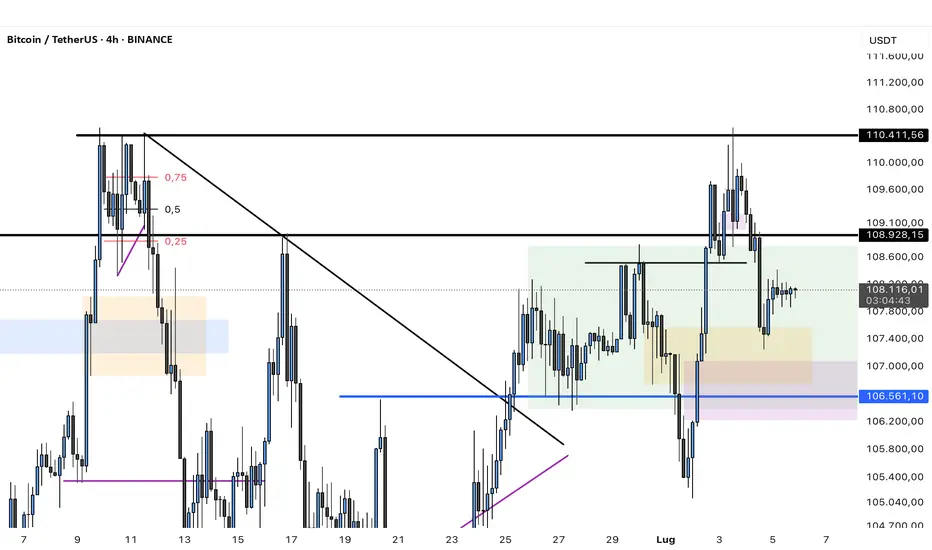
Innanzitutto, congratulazioni agli investitori che hanno seguito il piano quando in precedenza operavamo secondo il modello e avevamo un segnale short a 108k, prendevamo profitto e poi andavamo long nell'area di 106k.
Attualmente, BTC si trova nell'onda 5 ed è intrappolato nell'area di Fibonacci di 2.618, sezione aurea, intorno al prezzo di 109k; questa è anche la soglia di prezzo per gli investitori che sono sotto pressione prima che l'area di prezzo raggiunga i 112k.
L'area di 112k è un'area psicologica di profitto e apparirà sulla situazione di vendita a 109k prima che il prezzo di BTC possa aumentare ulteriormente negli ultimi 6 mesi dell'anno.
Bitcoin punta a 111.000 dollari e nuovi massimi!
Il grafico a 4 ore rafforza il trend rialzista con un chiaro pattern di massimi e minimi crescenti a partire da $ 105.130. L'aumento del volume in rialzo convalida la forza del movimento, sebbene il corpo della candela si sia recentemente ristretto, indicando un indebolimento dello slancio rialzista. Non ha ancora mostrato una chiara divergenza, ma una sovraestensione rappresenta un rischio. L'ingresso ideale si verifica durante la rottura del consolidamento intorno a $ 106.500, e si consiglia ora ai trader di proteggere i profitti sotto $ 108.500 impostando uno stop loss. Una chiusura sotto $ 109.000 in questo intervallo temporale potrebbe indicare una correzione a breve termine.
Se Bitcoin si mantiene sopra $ 109.000 e continua a superare la zona di resistenza tra $ 110.500 e $ 111.000, accompagnato da un volume di scambi sostenuto, la struttura rialzista rimarrà intatta. Sembrano probabili ulteriori guadagni verso nuovi massimi, soprattutto quando le medie mobili sono ampiamente supportate e l'impostazione del grafico giornaliero è buona.

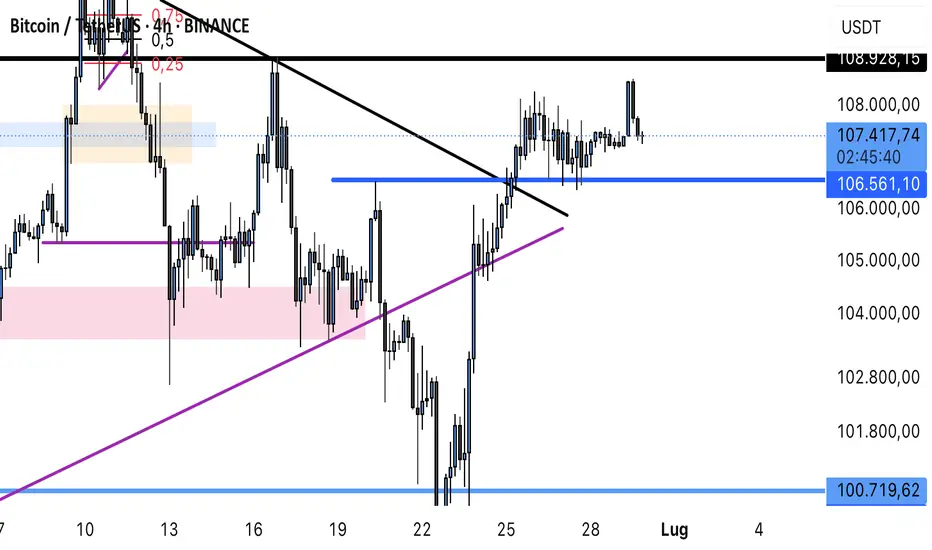
La chiave per Bitcoin è 107K
La posizione chiave della strategia di questo fine settimana è 107K
Se Bitcoin non mantiene questa posizione, Bitcoin scenderà ulteriormente per poi salire dopo il fine settimana.
Se questa posizione viene mantenuta, Bitcoin salirà direttamente!

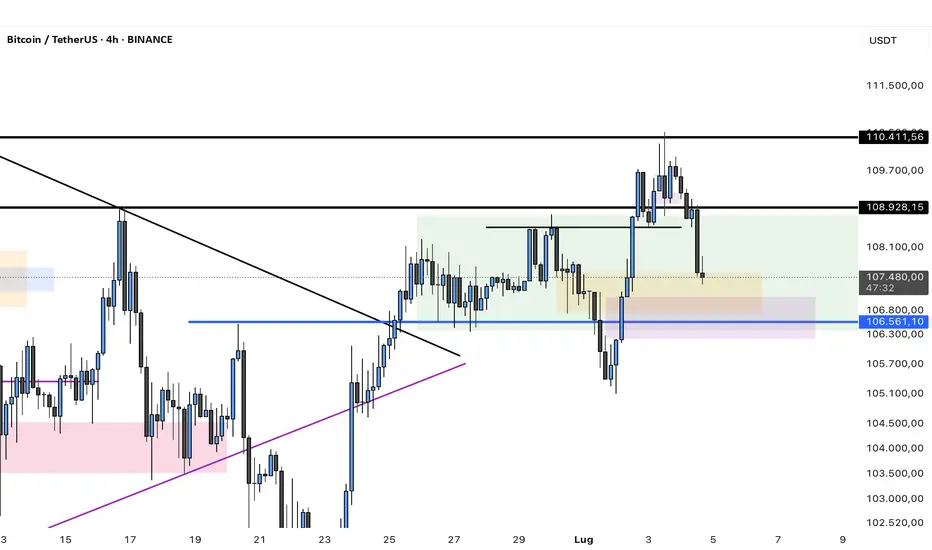
BTC rientra nel rangeIl prezzo del BTC oggi ha fatto un pullback a livello del range. Il prezzo non riesce ancora a rompere la zona dei 110.000 e ci sono ancora molti venditori a quel livello che riescono a far uscire gli acquirenti. Tuttavia, all'interno del range si sono create zone interessanti di rimbalzo rialzista come la FVG o la candela con lo stoppino che ha sostituito le vecchie FVG. Tenete d’occhio queste zone, è possibile che il prezzo rimbalzi al rialzo in questi livelli.
Bitcoin - Il pattern a bandiera è rottoBitcoin - Il pattern a bandiera è rotto
Bitcoin si era consolidato all'interno di un pattern a bandiera negli ultimi tre mesi. Questo pattern ha ora ufficialmente rotto al rialzo, con il prezzo che è balzato a 109.000 dollari – un forte segnale rialzista alimentato dalle notizie incoraggianti sull'adozione istituzionale.
Sulla base sia del breakout tecnico del pattern a bandiera che del momentum fondamentale in corso, il prossimo obiettivo per Bitcoin è 145.000 dollari. Qualsiasi movimento oltre questo limite sarebbe considerato un bonus in questo attuale ciclo rialzista.
Restate sintonizzati per ulteriori aggiornamenti.

BTC saleIl prezzo del BTC dovrebbe raggiungere durante la giornata la zona dei 110.000 con una forte spinta al rialzo. Dopo il pullback, ha reagito molto bene con rimbalzi sulle FVG, rendendo il prezzo del BTC molto rialzista. Nei prossimi giorni dovrebbe continuare a salire.

BTC rimbalza al rialzoIl prezzo del BTC ha effettuato un *sweep* dei minimi e ha iniziato a salire dopo aver recuperato la liquidità al di sotto. Il movimento del prezzo segue esattamente quanto previsto nelle analisi precedenti. Attualmente, il prezzo si trova in una fase di rialzo molto sana e dovrebbe facilmente superare nei prossimi giorni la zona dei 109.000. Se il prezzo rompe l’ultima resistenza attuale, allora ci saranno alte probabilità di una continuazione al rialzo.

BTC SWEEP → SWEEP di BTCIl prezzo del BTC mostra finalmente un po’ di movimento durante la giornata e si è potuto osservare che ha finalmente fatto uno SWEEP dei MINIMI della consolidazione, il che potrebbe permettere al prezzo di rimbalzare presto al rialzo. Tuttavia, non bisogna escludere che potrebbe continuare a fare uno SWEEP dei MINIMI.

Bitcoin avrà una sorpresa a luglio!
Gli ETF su Bitcoin hanno registrato un forte afflusso netto di 2,22 miliardi di dollari la scorsa settimana, rimanendo in territorio positivo per 3 settimane consecutive, segnando una delle settimane più positive del 2025.
La scorsa settimana, l'entusiasmo degli investitori è stato elevato, portando gli ETF spot su Bitcoin statunitensi a registrare una delle migliori performance settimanali del 2025. Con un afflusso netto di 2,22 miliardi di dollari, questa ha segnato la terza settimana consecutiva di afflussi netti per gli ETF su Bitcoin, a dimostrazione della fiducia nel crescente slancio istituzionale.
Martedì 24 giugno ha aperto la strada con un afflusso netto di 588,55 milioni di dollari, con afflussi che hanno superato il mezzo miliardo di dollari in due dei tre giorni della settimana. Durante tutto il periodo, cinque giornate di negoziazione hanno registrato afflussi netti, evidenziando un persistente tono rialzista.
Tuttavia, il settore ha incontrato una certa resistenza, con ETHE (18,43 milioni di dollari) e Mini Trust (6,94 milioni di dollari) di Grayscale che hanno registrato deflussi.
Con il volume degli scambi e il patrimonio netto in continua crescita, gli ETF su Bitcoin sembrano essere decisamente favoriti dal sentiment di propensione al rischio all'inizio di luglio.
Fidatevi, Bitcoin avrà una sorpresa a luglio!

Is Bitcoin Building a Bullish Head and Shoulders Pattern?from a technical point of view, it seems that bitcoin is building a perfect bullish head and shoulders pattern. also the volumes at the shoulders and the head confirm the pattern. now we have to wait for a significant increase in volumes that will serve to break the neckline and close above it.
i used the weekly timeframe because on instruments like cryptocurrencies i consider it the most reliable of all. normally the daily one is used.
in this case we will see the break of the neckline, close above the neckline and increasing volumes. then we could expect a pullback to test the neckline and then expect the rise towards the three profit points found with the fibonacci retracement.
we will update you.

BTC continua il suo range.Anche oggi, il BTC continua ad accumularsi al di sopra della rottura del triangolo, quindi non ho davvero molto da aggiungere alle analisi precedenti. Tuttavia, posso comunque dirvi che la volatilità sta iniziando a riprendere e che ci dovrebbe essere movimento nei prossimi giorni.
Che settimana fantastica per Bitcoin!
Come potete vedere, la nostra strategia e la precisione delle analisi nelle ultime due settimane sono prossime al 100%.
In particolare, il trend degli ultimi due giorni è esattamente lo stesso del grafico della mia idea precedente!
Inoltre, Jerome Powell, Presidente della Federal Reserve statunitense, è stato "sotto i riflettori" per due giorni consecutivi. Questa volta, di fronte alla Commissione Bancaria, Edilizia e Affari Urbani del Senato degli Stati Uniti, ha ammesso che le criptovalute non sono più un settore speculativo da evitare, ma un'innovazione promettente, "matura" e "che sta diventando sempre più mainstream". Dopo la diffusione della notizia, il mercato delle criptovalute in generale è leggermente aumentato dello 0,10% e Bitcoin è cresciuto dell'1,38%, raggiungendo i 108.000 dollari nelle prime fasi di trading.
"Il cambiamento è che, se si guarda indietro, si tratta di qualche anno fa, un periodo di fallimenti e frodi di alto profilo", ha spiegato Powell. "Cosa è successo? Il settore sta maturando, la nostra comprensione sta migliorando e, in un certo senso, sta diventando più diffuso."
Le dichiarazioni di Powell non sono l'unica ragione della performance positiva di Bitcoin oggi, ma hanno sicuramente contribuito. Al momento della pubblicazione del report, Bitcoin era scambiato tra $ 105.359,97 e $ 108.168,40, con il prezzo attuale di $ 107.364,36, in rialzo dell'1,25% rispetto a ieri e del 3,05% rispetto alla scorsa settimana. Tuttavia, nonostante lo slancio rialzista, il volume degli scambi è diminuito del 14,25%, attestandosi a $ 51,05 miliardi.
La capitalizzazione di mercato totale di Bitcoin è salita a $ 2,13 trilioni, con un aumento dell'1,39% rispetto a ieri. La dominance di BTC è salita al 65,72%, con un aumento significativo dello 0,71%, il livello più alto da gennaio 2021.
I dati del mercato dei future hanno mostrato che l'open interest totale di BTC è aumentato del 4,85% a 73,31 miliardi di dollari, secondo i dati di Coinglass. I mercati dei derivati hanno dipinto un quadro rialzista positivo nelle ultime 24 ore. Sono state liquidate posizioni in Bitcoin per circa 71,39 milioni di dollari. Le liquidazioni short hanno raggiunto un totale di 60,46 milioni di dollari, mentre le liquidazioni long sono state relativamente contenute, attestandosi a 10,93 milioni di dollari.

Bitcoin supera i 110.000 dollari.
Bitcoin si trova attualmente in un intervallo di consolidamento ristretto ma significativo, in un contesto rialzista più ampio.
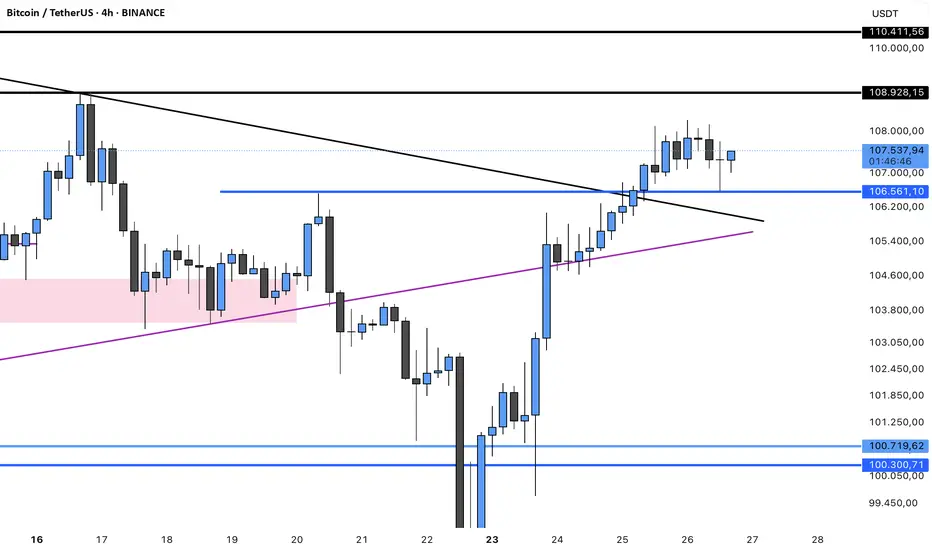
Nel medio termine, il grafico BTC/USD a 4 ore mostra una struttura a bandiera rialzista con un trend rialzista complessivamente lento. La candela di breakout vicino al livello di 108.358 dollari e un significativo aumento dei volumi suggeriscono una crescente fiducia degli acquirenti. Un nuovo test riuscito dell'area tra 107.000 e 107.500 dollari potrebbe offrire un'opportunità di ingresso a basso rischio per posizioni rialziste. Al contrario, una rottura prolungata al di sotto di 106.800 dollari invaliderebbe la struttura a breve termine e giustificherebbe una rivalutazione del bias direzionale.
Nel grafico a 1 ora, Bitcoin sta dimostrando un momentum a breve termine attraverso un consolidamento ristretto e un successivo rapido movimento al rialzo. La conferma del volume durante la recente candela verde convalida un breakout rialzista che sembra provenire da una zona di accumulo. I trader che desiderano trarre vantaggio da questa configurazione potrebbero considerare un ingresso in pullback nell'intervallo tra $ 107.700 e $ 108.000. Soprattutto se accompagnato da un aumento del volume sell-side, sarebbe opportuno considerare l'impostazione di uno stop loss protettivo al di sotto di $ 107.200.
Conclusione rialzista:
Dato che tutte le principali medie mobili sono in modalità acquisto, insieme ai segnali rialzisti provenienti dal momentum (10) e dalla convergenza divergente della media mobile (MACD), la struttura tecnica dei grafici a 1 ora, a 4 ore e giornalieri supporta la continuazione del trend rialzista. Una rottura sopra i $ 110.000 con un volume elevato può confermare la dominanza rialzista e aprire la strada a nuovi massimi.

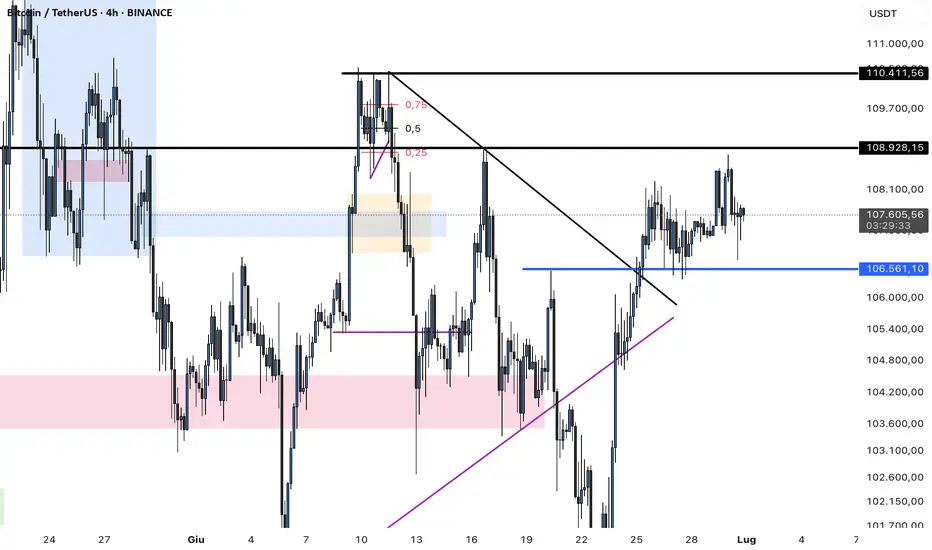
Piccolo sweep dell’alto BTC.Il prezzo del BTC si trova ancora oggi in un range nella zona. Tuttavia, ha fatto un rapido sweep del massimo, il che potrebbe forse indicare l’intenzione di sweepare anche i minimi, per poi rimbalzare verso l’alto.
BTC si accumulaIl prezzo del BTC continua attualmente la sua fase di accumulo al di sopra della resistenza diventata supporto e al di sopra della rottura del triangolo. Durante la prossima settimana, il prezzo dovrebbe avere buone probabilità di fare un sweep dei loss prima di riprendere il suo rimbalzo rialzista.

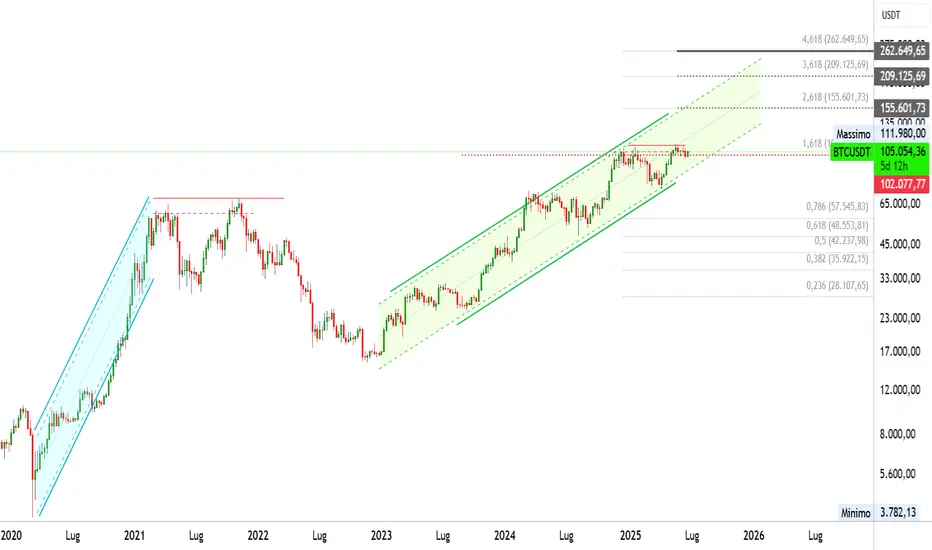
BitcoinBitcoin continuerà a salire — Grafico a lungo termine — Nuovo massimo storico di oltre $200.000
Nel novembre 2021, la settimana successiva al massimo storico è crollata. Le settimane successive sono state una continuazione e il mercato è entrato in rosso, continuando a scendere fino a novembre 2022, un anno dopo.
Nel maggio 2025, la settimana successiva al massimo storico è neutrale, laterale. Quattro settimane dopo, Bitcoin continua a muoversi lateralmente, consolidandosi vicino alla resistenza, pronto a raggiungere nuovi massimi e continuare a salire.
Le condizioni di mercato attuali sono molto, molto diverse rispetto al 2021. Al momento, siamo solo a metà dell'attuale mercato rialzista per Bitcoin e abbiamo ancora spazio per una crescita considerevole.
Nel giro di pochi giorni, forse 5-6 giorni, raggiungeremo un nuovo massimo storico e questo non significherà la fine del mercato rialzista, ma l'inizio della prossima e ultima ondata rialzista.
Questi obiettivi sul grafico sono i più accurati di tutti i numeri perché si basano su quasi 5 anni di dati.
Il prossimo obiettivo e prezzo minimo per Bitcoin nei prossimi mesi è di $ 155.601, ma sappiamo che probabilmente ce ne saranno di più, molto di più. Con l'ondata istituzionale ormai in piena forza, le banche che aprono alle criptovalute perché non hanno altra scelta e il mondo che si evolve più velocemente di quanto pensassimo possibile, puntiamo a $ 200.000 o più.
Il prossimo livello rilevante dopo $ 155.600 è $ 209.125. Qual è il tuo obiettivo per questo nuovo massimo storico del 2025?
Pensi che Bitcoin raggiungerà il picco a fine 2025 o inizio 2026?
Pensi di riuscire ad avere successo in questo round o sei destinato a commettere gli stessi errori? Trading eccessivo, leva finanziaria eccessiva, mancanza di pazienza; non aspettare il momento giusto per entrare e non vendere quando il mercato è molto alto, avidità; cosa sarà?
Pensi di avere le carte in regola per avere successo? Certo!
Anche se hai commesso errori in passato o se stai già andando bene, hai le carte in regola.
Se stai andando male, questa esperienza può essere usata per migliorare. Se stai andando alla grande, alla grande, facciamo meglio. Non si cresce mai abbastanza; siamo felici, siamo grati, ma accettiamo l'abbondanza perché la riceviamo grazie al duro lavoro.
È ancora molto presto, ma il mercato sta iniziando a scaldarsi. Una volta iniziata l'azione rialzista, non c'è nulla che possa fermarci. Il mondo cambierà per noi. Ci adatteremo a tutte le condizioni di mercato e geopolitiche, continueremo a migliorare ed evolverci.
Il migliore non è chi non commette errori, ma chi sa trarre insegnamento da tutte le esperienze. Il successo non è avere sempre ragione, il successo è non arrendersi mai.
Ti arrenderai? O continuerai a fare trading a lungo termine?
» Bitcoin sta salendo!
BTC si sta consolidando.Il prezzo del BTC continua a consolidarsi dopo la rottura del triangolo, rendendo possibile uno sweep del minimo e una ripartenza al rialzo. Tuttavia, il prezzo mantiene la sua tendenza di fondo rialzista e dovrebbe presto rimbalzare.

BTC ha fatto un PULLBACKIl prezzo del BTC si è mostrato durante la giornata dopo la rottura della resistenza e del suo triangolo, entrando in una fase di espansione rialzista.
A rafforzare questo movimento nel corso della giornata è stato il suo pullback, toccato dalla shadow di un martello rialzista, che ha reagito immediatamente al rialzo, aumentando le probabilità che il BTC mantenga la sua tendenza al rialzo senza dover tornare indietro.
BTC: Un classico modello a tazza e manico in gioco!BTC: Un classico modello a tazza e manico in gioco!
Bitcoin ha formato un classico modello a tazza e manico sul grafico giornaliero, con la media mobile esponenziale a 100 Mbps che fornisce un solido supporto durante la formazione del manico. Attualmente, il prezzo si sta consolidando in quella che sembra essere una bandiera rialzista o un manico esteso, appena al di sotto della zona di resistenza chiave intorno ai 109.000 dollari. Un breakout al di sopra di questo livello potrebbe innescare un forte rally rialzista verso obiettivi più alti come i 144.000 dollari.
Aspetti principali:
- Conferma del modello a tazza e manico
- La media mobile esponenziale a 10 Mbps funge da supporto dinamico
- Bandiera/manico rialzista che si forma vicino alla resistenza
- Un breakout potrebbe portare a un rialzo esplosivo

BTC probabilmente su una nuova partenza rialzista.Il prezzo del BTC ha rotto al rialzo sia il triangolo che la resistenza spiegati nell’analisi di ieri, mostrando quindi che molto probabilmente il prezzo andrà a cercare nuovi massimi e che l’espansione rialzista ha buone probabilità di continuare.
