2350 Technical Analysis: Breakout with Weekly Bullish Signals
2350 (Saudi Kayan Petrochemical Co.)
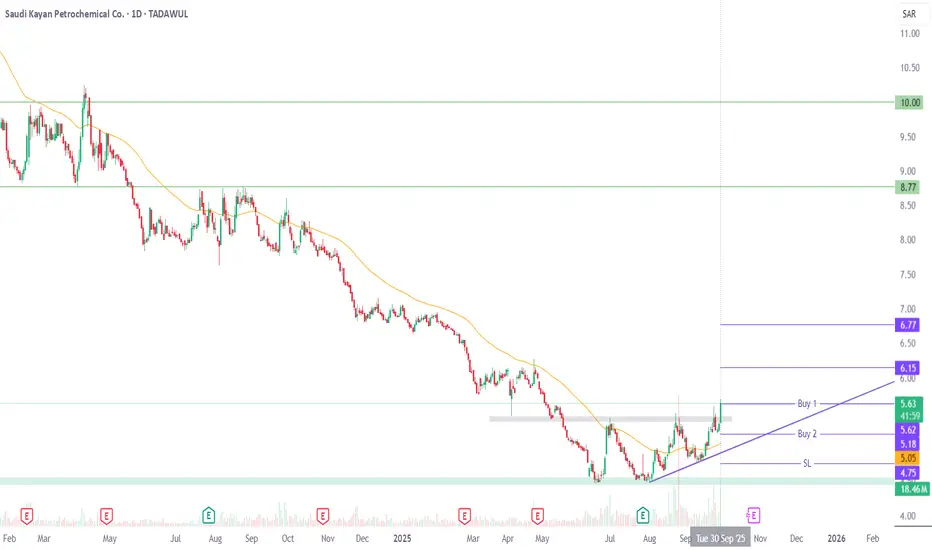
Price has broken out above the previous high, which had also been a major resistance level since May. It is trading above the 55 Fibonacci EMA, a level that has historically served as dynamic support.
On the weekly timeframe, price has broken out of a falling wedge, confirmed a double bottom, and printed bullish divergence — all of which strengthen the bullish outlook.
The first buy is at CMP, with Buy 2 positioned lower to average in on a pullback. TP1 and TP2 are aligned with near-term resistances, while sustained momentum beyond TP2 opens room for price to extend toward 8.77 and even 10. Stop loss is set below 4.75 on a closing basis to define risk.
Recommended Levels:
Buy 1: 5.62 (CMP)
Buy 2: 5.18
Stop Loss: Closing below 4.75
Take Profit 1: 6.15
Take Profit 2: 6.77
Take Profit 3: Ride the trend with a trailing stop
Potential upside remains as long as momentum sustains above the breakout zone and 55 EMA. Happy trading!
Trade attivo
TP1 hitDeclinazione di responsabilità
Le informazioni e le pubblicazioni non sono intese come, e non costituiscono, consulenza o raccomandazioni finanziarie, di investimento, di trading o di altro tipo fornite o approvate da TradingView. Per ulteriori informazioni, consultare i Termini di utilizzo.
Declinazione di responsabilità
Le informazioni e le pubblicazioni non sono intese come, e non costituiscono, consulenza o raccomandazioni finanziarie, di investimento, di trading o di altro tipo fornite o approvate da TradingView. Per ulteriori informazioni, consultare i Termini di utilizzo.