Amazon (AMZN) Shares Reach $250 for the First Time
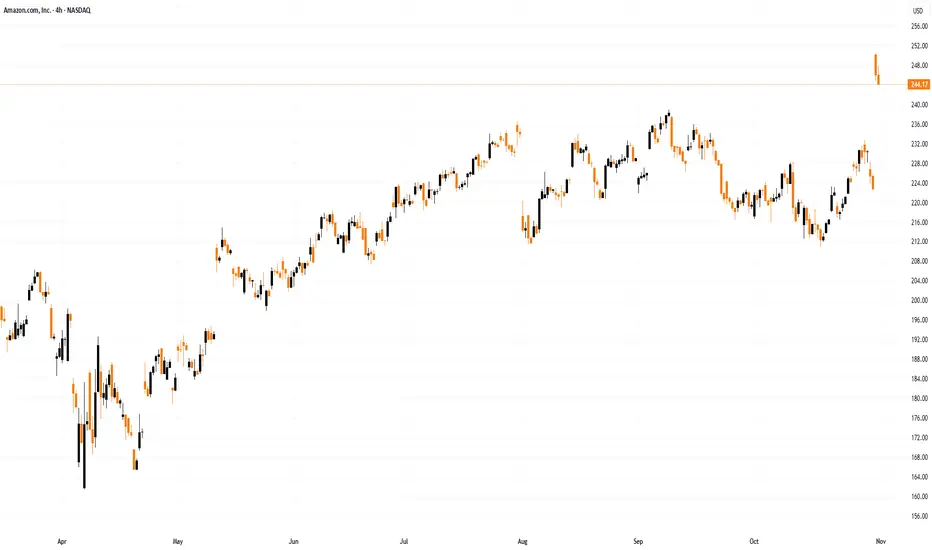
As the chart shows, Amazon (AMZN) shares rose to a record high on Friday, reaching the $250 mark for the first time. This came after the publication of a strong earnings report:
→ Revenue: $180.2 billion (up 13% year on year).
→ Earnings per share (EPS): actual = $1.95, forecast = $1.56 (a 25% beat).
Investor sentiment was further boosted by the following:
→ AWS (Amazon Web Services) revenue grew by 20% year on year, despite competition from Microsoft Azure and Google Cloud.
→ Amazon issued a confident outlook for the crucial holiday (fourth) quarter.

Technical Analysis of Amazon (AMZN) Chart
When analysing the chart on 24 September, we:
→ used AMZN share price fluctuations to construct an upward channel (shown in blue);
→ noted early signs of weakness.
Subsequently, the price reached a low at point A – where the bulls found support from the lower boundary of the channel and the August low (in fact, there was a false bearish breakout) – and made a successful attempt to resume the uptrend.
The two red candles on Friday suggest that the initial reaction to the report may have been overly optimistic (as confirmed by the RSI indicator). Therefore, it is possible that a corrective move will follow – for example, towards the support area that includes:
→ the median line of the current channel;
→ the previous all-time high of $242;
→ the September high around $238;
→ the 0.382 Fibonacci retracement level of the A→B impulse, around $235.
This article represents the opinion of the Companies operating under the FXOpen brand only. It is not to be construed as an offer, solicitation, or recommendation with respect to products and services provided by the Companies operating under the FXOpen brand, nor is it to be considered financial advice.
As the chart shows, Amazon (AMZN) shares rose to a record high on Friday, reaching the $250 mark for the first time. This came after the publication of a strong earnings report:
→ Revenue: $180.2 billion (up 13% year on year).
→ Earnings per share (EPS): actual = $1.95, forecast = $1.56 (a 25% beat).
Investor sentiment was further boosted by the following:
→ AWS (Amazon Web Services) revenue grew by 20% year on year, despite competition from Microsoft Azure and Google Cloud.
→ Amazon issued a confident outlook for the crucial holiday (fourth) quarter.
Technical Analysis of Amazon (AMZN) Chart
When analysing the chart on 24 September, we:
→ used AMZN share price fluctuations to construct an upward channel (shown in blue);
→ noted early signs of weakness.
Subsequently, the price reached a low at point A – where the bulls found support from the lower boundary of the channel and the August low (in fact, there was a false bearish breakout) – and made a successful attempt to resume the uptrend.
The two red candles on Friday suggest that the initial reaction to the report may have been overly optimistic (as confirmed by the RSI indicator). Therefore, it is possible that a corrective move will follow – for example, towards the support area that includes:
→ the median line of the current channel;
→ the previous all-time high of $242;
→ the September high around $238;
→ the 0.382 Fibonacci retracement level of the A→B impulse, around $235.
This article represents the opinion of the Companies operating under the FXOpen brand only. It is not to be construed as an offer, solicitation, or recommendation with respect to products and services provided by the Companies operating under the FXOpen brand, nor is it to be considered financial advice.
Declinazione di responsabilità
The information and publications are not meant to be, and do not constitute, financial, investment, trading, or other types of advice or recommendations supplied or endorsed by TradingView. Read more in the Terms of Use.
Declinazione di responsabilità
The information and publications are not meant to be, and do not constitute, financial, investment, trading, or other types of advice or recommendations supplied or endorsed by TradingView. Read more in the Terms of Use.