The stock has successfully reached the initial target as per the previous analysis. Upon re-evaluation, further bullish potential is evident, but key resistance levels may interrupt immediate upside continuation.
1. Resistance and Potential Retracement:
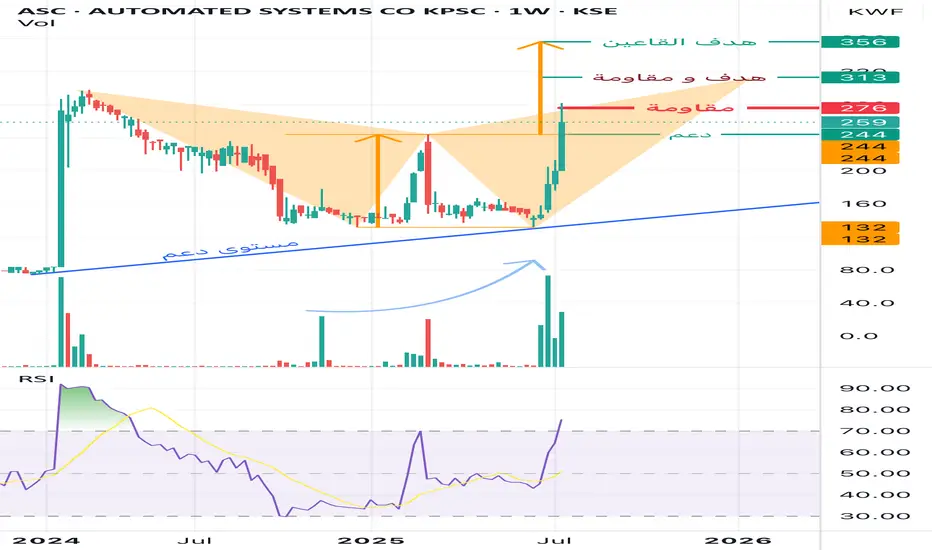
• The stock is currently facing a strong resistance at 276 KWF, which has temporarily capped the current rally.
• A pullback to the 244 KWF support level is possible, serving as a healthy retest before any renewed breakout attempt.
2. Harmonic Pattern – Shark 🦈:
• The current structure aligns with a Shark harmonic pattern, projecting a target at 313 KWF, which also coincides with a major resistance level.
• Due to this confluence, the 313 level serves both as a target and a barrier, making it a critical decision point for bulls and institutional players.
3. Double Bottom Formation (Pattern Analysis):
• A symmetrical double bottom pattern is visible, suggesting a more extended bullish outlook.
• This pattern projects a potential longer-term target at 356 KWF, which could be the area where smart money (market makers) aim to unload positions.
4. Volume and Momentum:
• Volume has shown a noticeable increase, reflecting growing market interest and accumulation.
• The RSI indicator has surged sharply but is approaching overbought territory, indicating momentum is strong, though some cooling may occur.
Consclusion
• The stock remains in a bullish structure, but is currently testing a key resistance level.
• A pullback to 244 would be technically constructive if followed by a breakout above 276.
• If 276 is breached decisively, the next objectives would be:
• Target 1 / Resistance: 313 KWF (Shark pattern)
• Target 2: 356 KWF (Double Bottom pattern)
Recommendation:
Monitor price behavior around 276. A successful breakout with volume confirmation opens the way toward 313 and beyond. A pullback to 244 can be considered a strategic re-entry opportunity within the broader bullish framework.
1. Resistance and Potential Retracement:
• The stock is currently facing a strong resistance at 276 KWF, which has temporarily capped the current rally.
• A pullback to the 244 KWF support level is possible, serving as a healthy retest before any renewed breakout attempt.
2. Harmonic Pattern – Shark 🦈:
• The current structure aligns with a Shark harmonic pattern, projecting a target at 313 KWF, which also coincides with a major resistance level.
• Due to this confluence, the 313 level serves both as a target and a barrier, making it a critical decision point for bulls and institutional players.
3. Double Bottom Formation (Pattern Analysis):
• A symmetrical double bottom pattern is visible, suggesting a more extended bullish outlook.
• This pattern projects a potential longer-term target at 356 KWF, which could be the area where smart money (market makers) aim to unload positions.
4. Volume and Momentum:
• Volume has shown a noticeable increase, reflecting growing market interest and accumulation.
• The RSI indicator has surged sharply but is approaching overbought territory, indicating momentum is strong, though some cooling may occur.
Consclusion
• The stock remains in a bullish structure, but is currently testing a key resistance level.
• A pullback to 244 would be technically constructive if followed by a breakout above 276.
• If 276 is breached decisively, the next objectives would be:
• Target 1 / Resistance: 313 KWF (Shark pattern)
• Target 2: 356 KWF (Double Bottom pattern)
Recommendation:
Monitor price behavior around 276. A successful breakout with volume confirmation opens the way toward 313 and beyond. A pullback to 244 can be considered a strategic re-entry opportunity within the broader bullish framework.
Declinazione di responsabilità
Le informazioni e le pubblicazioni non sono intese come, e non costituiscono, consulenza o raccomandazioni finanziarie, di investimento, di trading o di altro tipo fornite o approvate da TradingView. Per ulteriori informazioni, consultare i Termini di utilizzo.
Declinazione di responsabilità
Le informazioni e le pubblicazioni non sono intese come, e non costituiscono, consulenza o raccomandazioni finanziarie, di investimento, di trading o di altro tipo fornite o approvate da TradingView. Per ulteriori informazioni, consultare i Termini di utilizzo.