ASTRAL LTD; CMP: 1558.50
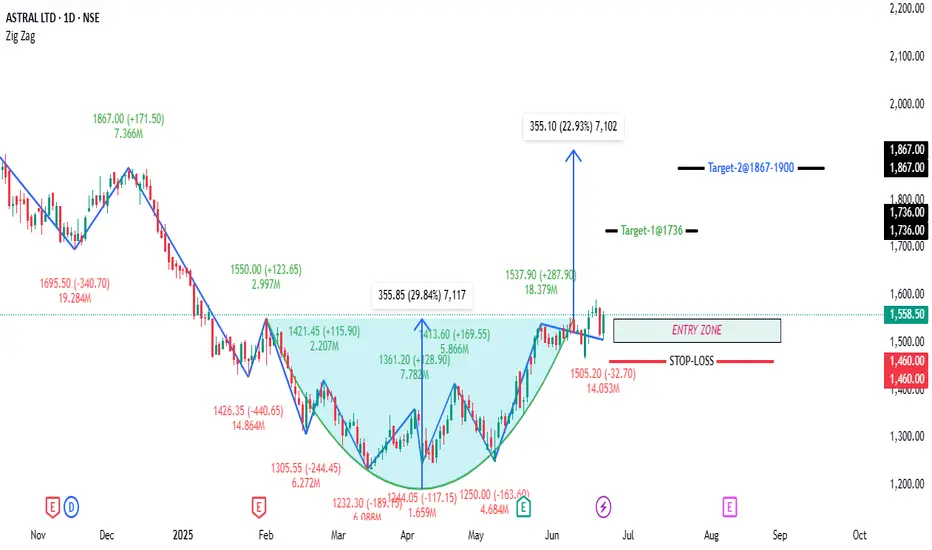
The stock formed a clean rounding bottom from the lows near ₹1230 (Mar 2025) to the breakout above ₹1537.
Breakout occurred with increased volume (18.3M), validating the move.
RSI is at 61.33, indicating momentum is positive but not overbought — favorable for further upside.
The stock has sustained above the breakout zone (~₹1537), which was the neckline and now acts as support.
📈 Long Trade Recommendation
Buy Zone: Current levels around ₹1550–₹1560 (post-breakout pullback and retest looks complete)
Target: ₹1900 (based on height of base: ~355 points from ₹1537 breakout = 1537 + 355)
Stop Loss: ₹1475 (on closing basis) – below recent pullback low and prior support.
Risk-Reward Ratio:4:1 → Strong trade setup.
🔐 Key Support and Resistance Levels
🔼 Resistance Zones:
🔽 Support Zones:
The stock formed a clean rounding bottom from the lows near ₹1230 (Mar 2025) to the breakout above ₹1537.
Breakout occurred with increased volume (18.3M), validating the move.
RSI is at 61.33, indicating momentum is positive but not overbought — favorable for further upside.
The stock has sustained above the breakout zone (~₹1537), which was the neckline and now acts as support.
📈 Long Trade Recommendation
Buy Zone: Current levels around ₹1550–₹1560 (post-breakout pullback and retest looks complete)
Target: ₹1900 (based on height of base: ~355 points from ₹1537 breakout = 1537 + 355)
Stop Loss: ₹1475 (on closing basis) – below recent pullback low and prior support.
Risk-Reward Ratio:4:1 → Strong trade setup.
🔐 Key Support and Resistance Levels
🔼 Resistance Zones:
- ₹1650–₹1695: Intermediate resistance (previous swing high from Dec 2024)
- ₹1735: 1M Pivot Low — may act as resistance due to confluence
- ₹1867: 1W Pivot High
- ₹1900: Target zone and psychological round number
🔽 Support Zones:
- ₹1537: Breakout level (1D Pivot High) — now key support
- ₹1505: Retest level (recent swing low post-breakout)
- ₹1482: 1D Pivot Low
- ₹1475: Stop-loss level — below this structure breaks
- A close below ₹1475 would invalidate the bullish setup.
- Watch for volume follow-through above ₹1600 levels to sustain the move.
- Trailing stop-loss can be adjusted to ₹1537 once price sustains above ₹1650 for multiple sessions
Trade chiuso manualmente
Setup has been invalidated so closing the the thread.However the The chart shows a classic 5-wave Elliott pattern for ASTRAL LTD. The waves are marked in the chart
Interpretation:
• The chart suggests that Wave (V) has completed near the recent peak around 2,500–2,700 levels.
• After the peak of Wave (V), a larger corrective pattern (A-B-C) typically follows, which is consistent with the decline shown in 2025.
• After a full 5-wave impulse, a corrective A-B-C phase often retraces much of the prior advance.
• Common retracement levels:
o 38.2%, 50%, and 61.8% Fibonacci retracement from the low of Wave II to the high of Wave V.
• The price has already corrected to around 1,250–1,400, which is close to the 50% retracement of the move from Wave (II) to Wave (V).
• However full A-B-C pattern is not yet identified with certainty, if the price sustains above 1,200–1,400 and forms a base, a new pull back B phase may take the prices as high at 1850 to 1900. Those who hold the share can wait for another 3-6 months for above targets.
Pubblicazioni correlate
Declinazione di responsabilità
Le informazioni ed i contenuti pubblicati non costituiscono in alcun modo una sollecitazione ad investire o ad operare nei mercati finanziari. Non sono inoltre fornite o supportate da TradingView. Maggiori dettagli nelle Condizioni d'uso.
Pubblicazioni correlate
Declinazione di responsabilità
Le informazioni ed i contenuti pubblicati non costituiscono in alcun modo una sollecitazione ad investire o ad operare nei mercati finanziari. Non sono inoltre fornite o supportate da TradingView. Maggiori dettagli nelle Condizioni d'uso.