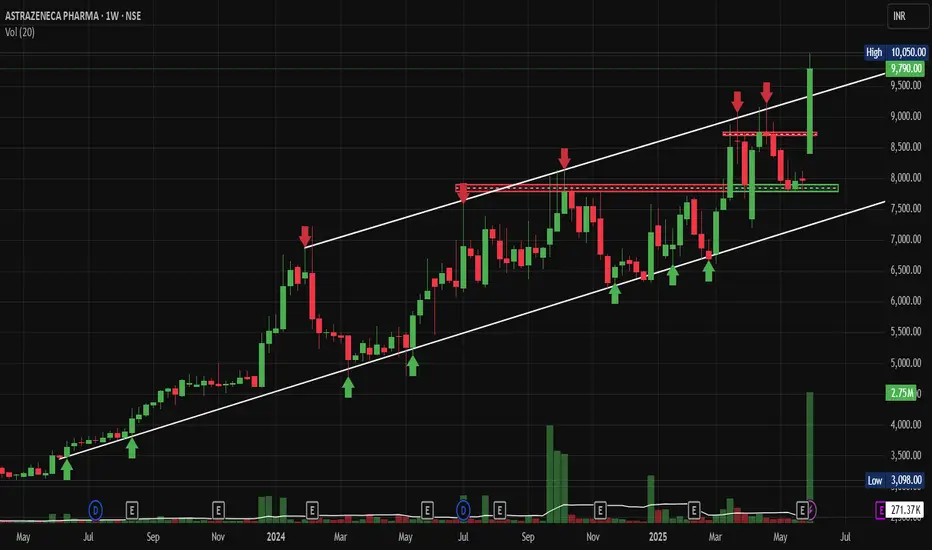
Price Action Analysis:
• Stock has been in a strong uptrend since May 2024, rising from around 3000 levels to current levels near 9800
• Recent price action shows consolidation between the 7500-8500 levels with multiple tests of resistance
• Current price at 9409 represents a +22.80% gain, showing strong momentum
• Volume spike visible in recent sessions at 2.75M shares vs average, indicating institutional interest
• Price structure shows a higher highs and higher lows pattern intact.
Key Support and Resistance Levels:
• Primary Support: 8000-8200 zone (previous resistance turned support)
• Secondary Support: 7500-7600 (multiple bounce zone)
• Key Resistance: 8500-8600 (red horizontal line showing multiple rejections)
• Breakout Resistance: 9000 psychological level
• Current High: 10,950 acting as immediate resistance
Base Formation and Patterns:
• Rectangle consolidation pattern formed between 7500-8500 from September 2024 to March 2025
• Bullish flag pattern visible after the breakout above 8500
• Ascending triangle formation with higher lows and flat resistance around 8500
• Volume expansion during breakout confirms pattern validity
Technical Indicators:
• Strong upward-trending channel maintained since mid-2024
• Price trading above all major moving averages
• Momentum appears to be building after the recent consolidation phase
• Volume profile shows accumulation during base formation
Trade Setup:
Entry Strategy:
• Primary Entry: On pullback to 8800-9000 support zone
• Aggressive Entry: Current market price around 9400 for momentum play
• Conservative Entry: Wait for retest of 8500 breakout level
Exit Levels:
• Target 1: 10,500 (psychological resistance)
• Target 2: 11,200 (measured move from rectangle pattern)
• Target 3: 12,000 (extension target based on trend channel)
Risk Management:
• Stop Loss: 8200 for entries around 9000 (tight stop)
• Stop Loss: 7800 for swing positions (wider stop)
• Position Size: Risk 1-2% of portfolio per trade
• Risk-Reward Ratio: Minimum 1:2 for all entries
Position Sizing Guidelines:
• For 1% risk: Calculate position size based on distance to stop loss
• Maximum exposure: 3-5% of portfolio in a single stock
• Scale in approach: 50% on initial entry, 30% on pullback, 20% on confirmation
Sectoral and Fundamental Backdrop:
Pharmaceutical Sector Overview:
• Indian pharma sector benefiting from global generic drug demand
• Regulatory approvals and US FDA compliance driving growth
• Export-oriented companies are seeing currency tailwinds
• Increased healthcare spending post-pandemic, supporting sector growth
AstraZeneca Pharma Fundamentals:
• Strong presence in oncology and respiratory segments
• Robust pipeline of innovative drugs and biosimilars
• Strategic partnerships with global pharmaceutical companies
• Consistent revenue growth and expanding market share in India
• Strong balance sheet with healthy cash flows
Market Dynamics:
• Institutional buying is visible through increased volumes
• FII interest in pharmaceutical stocks remains positive
• Sector rotation favouring defensive healthcare plays
• Government initiatives supporting pharmaceutical manufacturing
Risk Factors:
Technical Risks:
• High volatility near resistance levels
• Potential for false breakouts given extended rally
• Volume confirmation required for sustained moves
• Overbought conditions in the short term
Fundamental Risks:
• Regulatory changes in pharmaceutical pricing
• Currency fluctuation impact on export revenues
• Competition from generic drug manufacturers
• Global economic slowdown affecting healthcare spending
Market Risks:
• Overall market correction could impact individual stocks
• Sector rotation away from pharmaceuticals
• Profit booking by institutional investors
• Global pharmaceutical industry headwinds
My Take:
Keep in the Watchlist.
NO RECO. For Buy/Sell.
📌Thank you for exploring my idea! I hope you found it valuable.
🙏FOLLOW for more
👍BOOST if you found it useful.
✍️COMMENT below with your views.
Meanwhile, check out my other stock ideas on the right side until this trade is activated. I would love your feedback.
Disclaimer: "I am not a SEBI REGISTERED RESEARCH ANALYST AND INVESTMENT ADVISER."
This analysis is intended solely for informational and educational purposes and should not be interpreted as financial advice. It is advisable to consult a qualified financial advisor or conduct thorough research before making investment decisions.
Pubblicazioni correlate
Declinazione di responsabilità
Le informazioni e le pubblicazioni non sono intese come, e non costituiscono, consulenza o raccomandazioni finanziarie, di investimento, di trading o di altro tipo fornite o approvate da TradingView. Per ulteriori informazioni, consultare i Termini di utilizzo.