AUD/JPY (2-hour timeframe), here’s a breakdown of what’s visible
AUD/JPY (2-hour timeframe), here’s a breakdown of what’s visible:
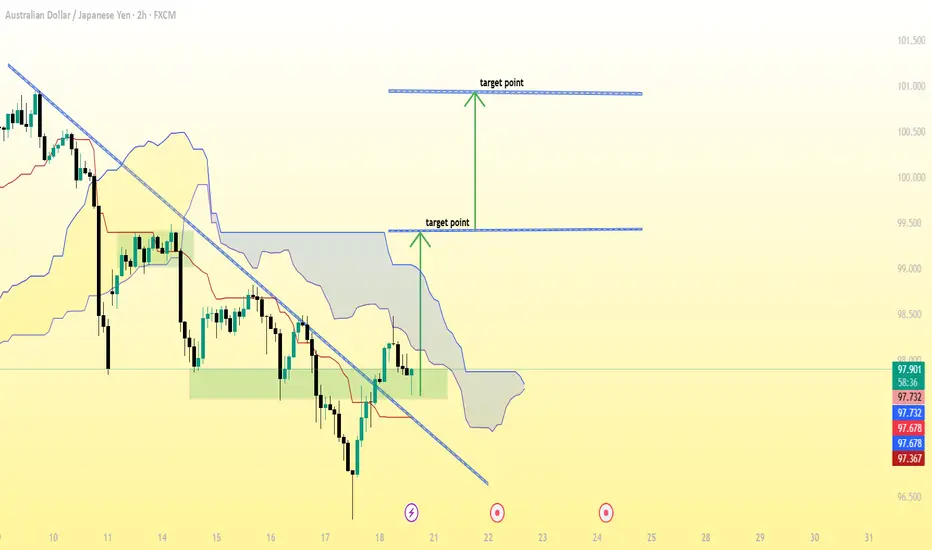
The downtrend line has been broken to the upside, suggesting a potential bullish reversal.
The Ichimoku Cloud shows price moving above or attempting to move above the cloud — another bullish signal.
Two target points are already marked on my chart:
1. First target: around 99.50
2. Second (final) target: around 100.75–101.00
✅ Summary of Target Zones:
🎯 Target 1: ~99.50
🎯 Target 2: ~100.75–101.00
📉 Stop Loss Suggestion:
My might place it just below the recent support or below the cloud (around 97.00–97.20 zone), depending on my risk tolerance.
Trade attivo
active activeTrade chiuso: obiettivo raggiunto
1st target done Pubblicazioni correlate
Declinazione di responsabilità
Le informazioni e le pubblicazioni non sono intese come, e non costituiscono, consulenza o raccomandazioni finanziarie, di investimento, di trading o di altro tipo fornite o approvate da TradingView. Per ulteriori informazioni, consultare i Termini di utilizzo.
Pubblicazioni correlate
Declinazione di responsabilità
Le informazioni e le pubblicazioni non sono intese come, e non costituiscono, consulenza o raccomandazioni finanziarie, di investimento, di trading o di altro tipo fornite o approvate da TradingView. Per ulteriori informazioni, consultare i Termini di utilizzo.