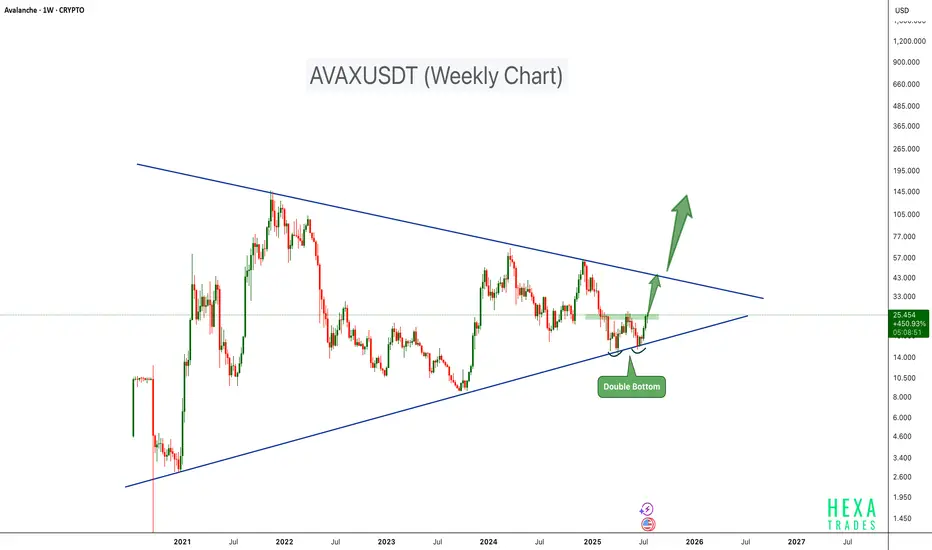
AVAX is showing signs of a strong bullish setup on the weekly chart, forming a double bottom pattern right at the lower support trendline of a long-term symmetrical triangle. This technical formation often indicates a potential trend reversal when confirmed with breakout and volume support.
Key Points:
-Double Bottom Support around $12–$14 with bullish momentum.
-Symmetrical Triangle structure compressing price for breakout.
-Breakout Zone near $27, a close above this level may trigger strong upside.
-Upside Target: Short-term Target- $45; Long Term Target - $125
Invalidation: A Break below $15 support could negate the setup.
Cheers
Hexa
 AVAX
AVAX  AVAXUSDT
Key Points:
-Double Bottom Support around $12–$14 with bullish momentum.
-Symmetrical Triangle structure compressing price for breakout.
-Breakout Zone near $27, a close above this level may trigger strong upside.
-Upside Target: Short-term Target- $45; Long Term Target - $125
Invalidation: A Break below $15 support could negate the setup.
Cheers
Hexa
🚀Telegram : t.me/hexatrades
🌐Website: hexatrades.io/
🗣️Twitter(X): twitter.com/HexaTrades
🌐Website: hexatrades.io/
🗣️Twitter(X): twitter.com/HexaTrades
Pubblicazioni correlate
Declinazione di responsabilità
Le informazioni e le pubblicazioni non sono intese come, e non costituiscono, consulenza o raccomandazioni finanziarie, di investimento, di trading o di altro tipo fornite o approvate da TradingView. Per ulteriori informazioni, consultare i Termini di utilizzo.