#AVAX is currently trading in a bearish market structure, but the chart is setting up for a major decision zone that could define its long-term trajectory.
Major Resistance Pressure Building
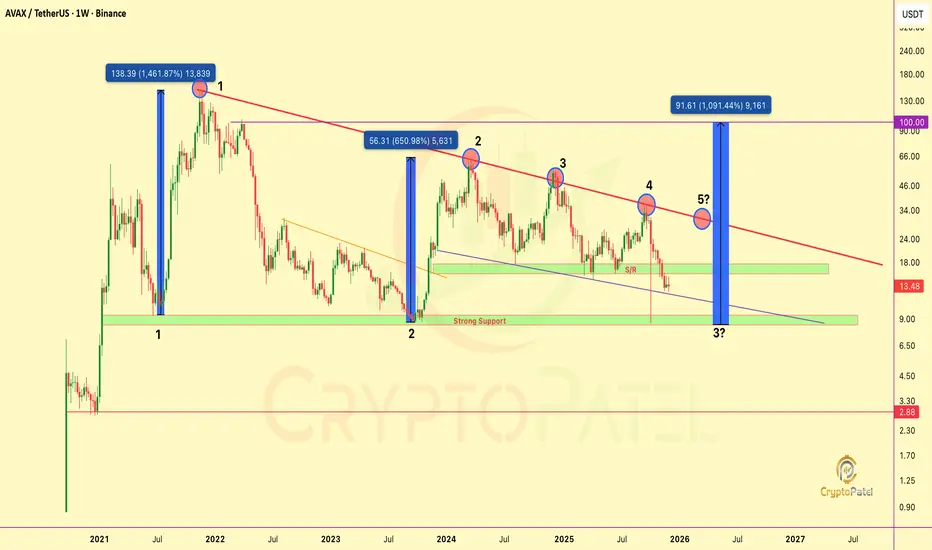
AVAX has tapped the Red trendline resistance 4 times, creating a historically strong barrier.
However, repeated tests have weakened the level, and the next approach, the 5th attempt near the $30 region, carries a significantly higher probability of a breakout.
A confirmed breakout here could shift momentum aggressively, opening the path toward the $100 zone.
Bearish Structure Still Dominant
Price has already lost key support and continues to trade below the $16–$17 zone, which has now flipped into resistance.
This is the first structure level bulls must reclaim to regain momentum.
High-Probability Accumulation Zone
The $10–$8 support zone remains the most critical area on the chart:
👉 June 2021: +1461% rally from this zone.
👉 September 2023: +650% rally within six months.
If AVAX revisits this zone again, it would represent the 3rd historical test, which has previously acted as a powerful accumulation region and could offer strong long-term upside potential.
Critical Breakdown Level
A loss of the $8 support would invalidate the bullish structure and expose AVAX to a potential freefall toward $3–$2, where no major historical support exists.
This is a pure technical-analysis view. Not financial advice. Always DYOR.
Twitter: twitter.com/CryptoPatel
Telegram: t.me/OfficialCryptoPatel
Instagram: instagram.com/cryptopatel?utm_medium=copy_link
Telegram: t.me/OfficialCryptoPatel
Instagram: instagram.com/cryptopatel?utm_medium=copy_link
Declinazione di responsabilità
Le informazioni e le pubblicazioni non sono intese come, e non costituiscono, consulenza o raccomandazioni finanziarie, di investimento, di trading o di altro tipo fornite o approvate da TradingView. Per ulteriori informazioni, consultare i Termini di utilizzo.