📈 Bank Nifty – Daily Timeframe Analysis
⸻⸻⸻⸻⸻⸻⸻⸻⸻⸻
📊 Key Observations
⸻⸻⸻⸻⸻⸻⸻⸻⸻⸻⸻
✅ Summary
⸻⸻⸻⸻⸻⸻⸻⸻⸻⸻⸻
⚠️ Disclaimer:
📘 For educational purposes only.
🙅 Not SEBI registered.
❌ Not a buy/sell recommendation.
🧠 Purely a learning resource.
📊 Not Financial Advice.
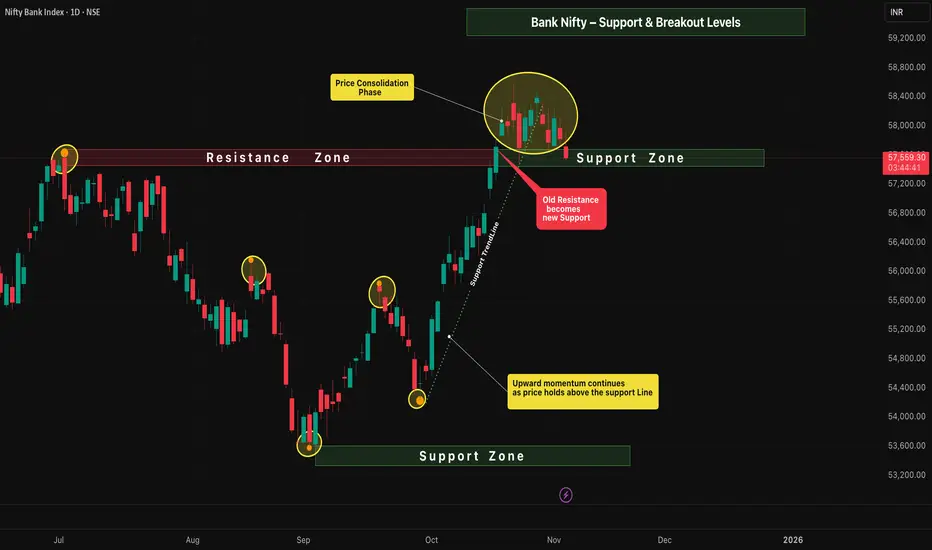
The price structure on the daily chart shows a healthy continuation of the upward momentum, maintaining strength above the key support zone.
Buyers are still in control, but the market has now entered a phase of sideways consolidation — signaling preparation for the next directional move.
⸻⸻⸻⸻⸻⸻⸻⸻⸻⸻
📊 Key Observations
1️⃣ Upward Momentum Continues — Price remains above the support line, showing sustained bullish control and healthy trend structure.
2️⃣ Consolidation Range — Price is currently consolidating between 58577.50 and 57482.05 , reflecting a balance between buyers and sellers.
3️⃣ Old Resistance → New Support — The previous resistance zone is now acting as a strong support base, adding confirmation to the bullish sentiment.
4️⃣ Breakout Scenarios —
A break above the consolidation high at 58,577.50 could ignite the next upward leg and continue the prevailing uptrend.
• A break below the support zone at 57,482.05 may shift momentum to the downside, opening the possibility of a move toward the previous support area.
⸻⸻⸻⸻⸻⸻⸻⸻⸻⸻⸻
✅ Summary
• Trend bias remains bullish as long as price holds above the key support line.
• Consolidation signals short-term indecision before the next major move.
• A confirmed breakout candle above 58,577.50 may open the path for further upside.
• Conversely, a breakdown below 57,482.05may invite short-term selling pressure toward the old support region.
⸻⸻⸻⸻⸻⸻⸻⸻⸻⸻⸻
⚠️ Disclaimer:
📘 For educational purposes only.
🙅 Not SEBI registered.
❌ Not a buy/sell recommendation.
🧠 Purely a learning resource.
📊 Not Financial Advice.
Declinazione di responsabilità
Le informazioni e le pubblicazioni non sono intese come, e non costituiscono, consulenza o raccomandazioni finanziarie, di investimento, di trading o di altro tipo fornite o approvate da TradingView. Per ulteriori informazioni, consultare i Termini di utilizzo.
Declinazione di responsabilità
Le informazioni e le pubblicazioni non sono intese come, e non costituiscono, consulenza o raccomandazioni finanziarie, di investimento, di trading o di altro tipo fornite o approvate da TradingView. Per ulteriori informazioni, consultare i Termini di utilizzo.