This Elliott Wave analysis on Bank Nifty (4H chart) outlines a classic impulsive wave structure with an extended Wave 3 and projected movement into Wave 4 and Wave 5. Let’s break it down step-by-step:
🌀 Wave Structure Identified:
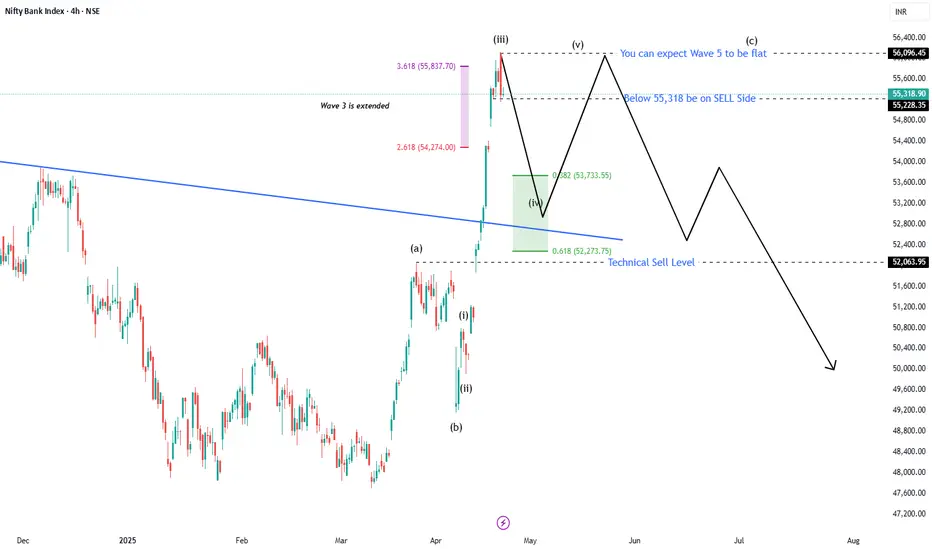
Wave (i) to (v) – This is the 5-wave impulsive move within Wave C of a larger corrective structure.
Wave 3 is extended – This is confirmed by the 2.618 and 3.618 Fibonacci extensions plotted, showing Wave 3 far exceeds Wave 1 in length.
You're currently in Wave 4, with potential completion near key Fib levels.
📉 Wave 4 Retracement Zone:
Wave 4 has retraced close to:
38.2% (~53,733.55)
61.8% (~52,273.75) of Wave 3
The shaded green box represents the Wave 4 retracement zone, typical for a corrective wave when Wave 3 is extended.
📊 Fibonacci Levels on the Chart:
3.618 ($5,837.70) – Extension of Wave 1, used to project the top of extended Wave 3.
Retracement levels – 0.382 and 0.618 of Wave 3 for Wave 4 correction.
These levels align with potential support areas where Wave 4 might end and Wave 5 may begin.
💡 Projection for Wave 5:
The note: “You can expect Wave 5 to be flat” implies a potential truncation or limited upside – common after an extended Wave 3.
Resistance level marked at 56,096.45 – Possible Wave 5 top or fake breakout zone.
🚨 Action Levels:
Below 55,318 – “Be on SELL Side” → Suggests if price breaks this level, bearish confirmation sets in.
Technical Sell Level: 52,063.95 – Key horizontal support; breach here may trigger stronger downside in a potential larger degree Wave C or corrective move.
🔍 Interpretation Summary:
Element Interpretation
Wave 3 Extended impulsive leg
Wave 4 Currently in progress, retracing into 38.2%-61.8% zone
Wave 5 Expected to be a flatter, possibly truncated move
Sell Triggers Below 55,318 and strong confirmation below 52,063.95
Bias Short-term correction, longer-term bearish if support breaks
🌀 Wave Structure Identified:
Wave (i) to (v) – This is the 5-wave impulsive move within Wave C of a larger corrective structure.
Wave 3 is extended – This is confirmed by the 2.618 and 3.618 Fibonacci extensions plotted, showing Wave 3 far exceeds Wave 1 in length.
You're currently in Wave 4, with potential completion near key Fib levels.
📉 Wave 4 Retracement Zone:
Wave 4 has retraced close to:
38.2% (~53,733.55)
61.8% (~52,273.75) of Wave 3
The shaded green box represents the Wave 4 retracement zone, typical for a corrective wave when Wave 3 is extended.
📊 Fibonacci Levels on the Chart:
3.618 ($5,837.70) – Extension of Wave 1, used to project the top of extended Wave 3.
Retracement levels – 0.382 and 0.618 of Wave 3 for Wave 4 correction.
These levels align with potential support areas where Wave 4 might end and Wave 5 may begin.
💡 Projection for Wave 5:
The note: “You can expect Wave 5 to be flat” implies a potential truncation or limited upside – common after an extended Wave 3.
Resistance level marked at 56,096.45 – Possible Wave 5 top or fake breakout zone.
🚨 Action Levels:
Below 55,318 – “Be on SELL Side” → Suggests if price breaks this level, bearish confirmation sets in.
Technical Sell Level: 52,063.95 – Key horizontal support; breach here may trigger stronger downside in a potential larger degree Wave C or corrective move.
🔍 Interpretation Summary:
Element Interpretation
Wave 3 Extended impulsive leg
Wave 4 Currently in progress, retracing into 38.2%-61.8% zone
Wave 5 Expected to be a flatter, possibly truncated move
Sell Triggers Below 55,318 and strong confirmation below 52,063.95
Bias Short-term correction, longer-term bearish if support breaks
Pubblicazioni correlate
Declinazione di responsabilità
Le informazioni ed i contenuti pubblicati non costituiscono in alcun modo una sollecitazione ad investire o ad operare nei mercati finanziari. Non sono inoltre fornite o supportate da TradingView. Maggiori dettagli nelle Condizioni d'uso.
Pubblicazioni correlate
Declinazione di responsabilità
Le informazioni ed i contenuti pubblicati non costituiscono in alcun modo una sollecitazione ad investire o ad operare nei mercati finanziari. Non sono inoltre fornite o supportate da TradingView. Maggiori dettagli nelle Condizioni d'uso.