Short
Bitcoin Cash chart is still down
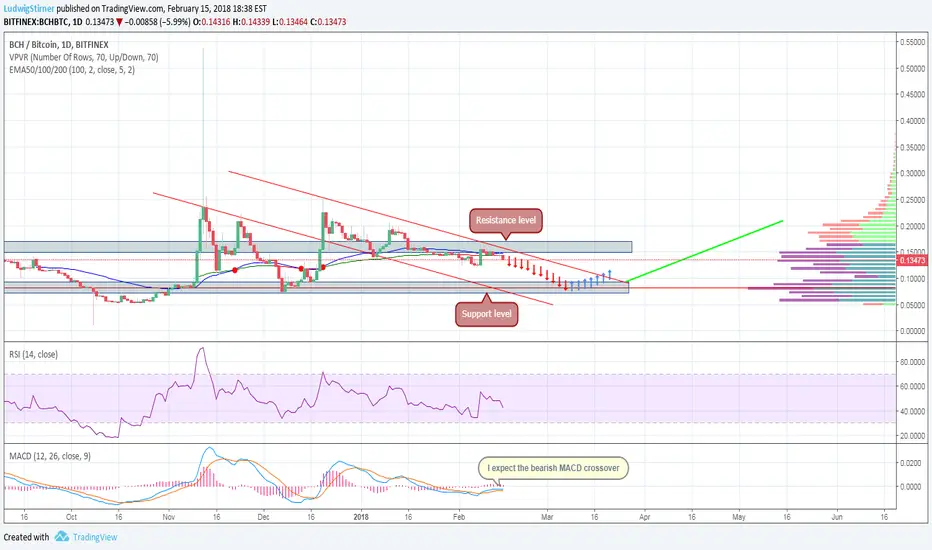
Long term, the trend of the Bitcoin Cash chart is still down. The 100-Day EMA provide significant resistance. The upper descending trend line also provide strong resistance.
RSI is below 50, a sign of an down trend. The MACD turned down but earlier the MACD showed positive divergence indicating the uptrend would begin however it might possible to be a fake buy signal.
RSI is below 50, a sign of an down trend. The MACD turned down but earlier the MACD showed positive divergence indicating the uptrend would begin however it might possible to be a fake buy signal.
Declinazione di responsabilità
Le informazioni ed i contenuti pubblicati non costituiscono in alcun modo una sollecitazione ad investire o ad operare nei mercati finanziari. Non sono inoltre fornite o supportate da TradingView. Maggiori dettagli nelle Condizioni d'uso.
Declinazione di responsabilità
Le informazioni ed i contenuti pubblicati non costituiscono in alcun modo una sollecitazione ad investire o ad operare nei mercati finanziari. Non sono inoltre fornite o supportate da TradingView. Maggiori dettagli nelle Condizioni d'uso.