Technical Analysis
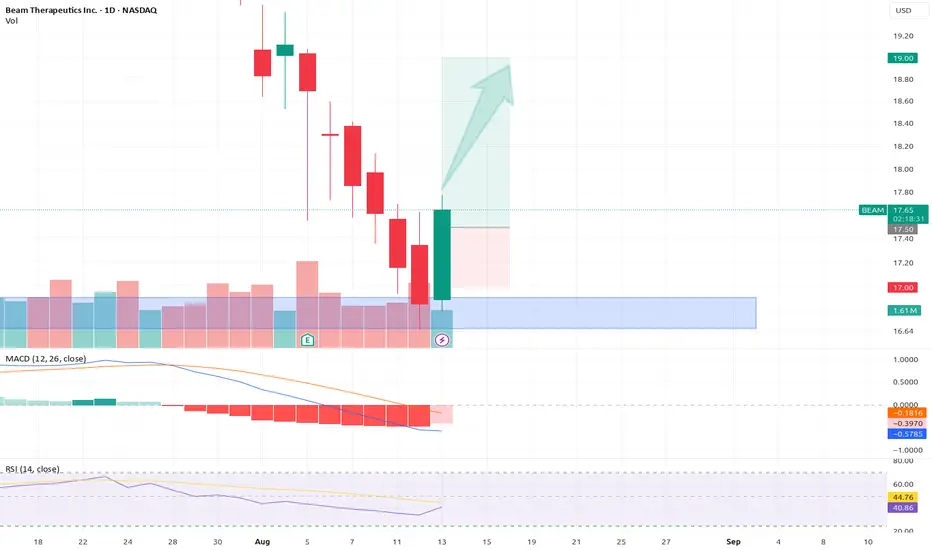
Instrument BEAM (Beam Therapeutics Inc.) – Daily/4H Chart
Key Support: Strong demand zone near $17, acting as a reversal level.
Indicators
MACD Bullish crossover above the zero line, signaling strengthening momentum.
RSI Bounced from ~50 (neutral), now trending upward without overbought conditions.
Structure Higher low formed at $17, suggesting a potential uptrend continuation.
Potential Scenarios
Bullish Breakout
If price holds above $17.50, next targets are $18.50 (resistance) and $19 (psychological level).
A close above $19 could extend gains toward $20.
Risk Management
Stop-Loss Below $17 (invalidates the reversal structure).
Take-Profit Scale out at $18.50 and $19.
Declinazione di responsabilità
Le informazioni ed i contenuti pubblicati non costituiscono in alcun modo una sollecitazione ad investire o ad operare nei mercati finanziari. Non sono inoltre fornite o supportate da TradingView. Maggiori dettagli nelle Condizioni d'uso.
Declinazione di responsabilità
Le informazioni ed i contenuti pubblicati non costituiscono in alcun modo una sollecitazione ad investire o ad operare nei mercati finanziari. Non sono inoltre fornite o supportate da TradingView. Maggiori dettagli nelle Condizioni d'uso.