📊 Full Technical Analysis
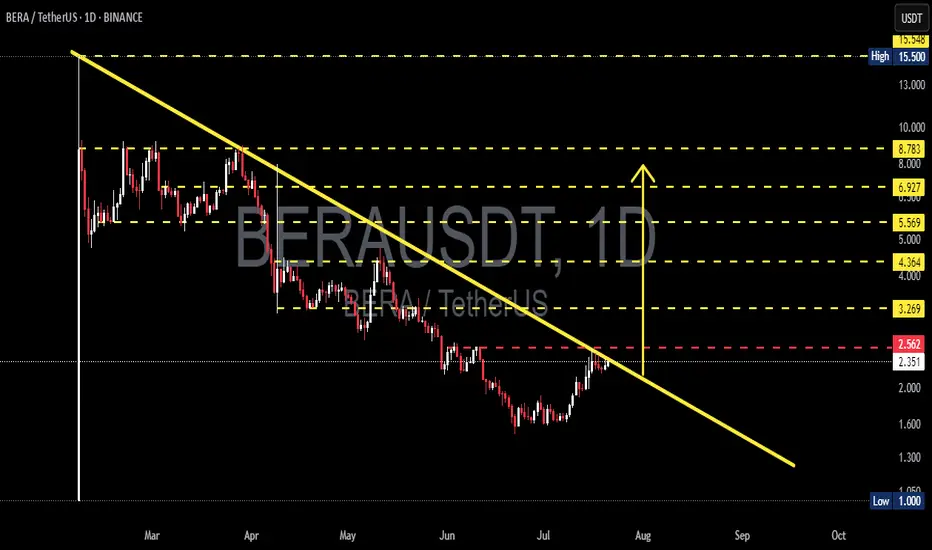
The BERA/USDT pair is displaying a highly compelling structure on the daily time frame, where the price has formed a Falling Wedge / Descending Triangle pattern over the past 4+ months.
This type of pattern often signals a large-scale accumulation phase by smart money, followed by an explosive breakout once selling pressure is exhausted and demand starts to dominate.
🧱 Pattern Structure: Falling Wedge / Descending Triangle
Descending trendline resistance (yellow line): Has suppressed price action since early March 2025
Horizontal support formed around the $1.00 to $2.00 zone (strong accumulation area)
Volume has been contracting — a typical sign of a wedge nearing breakout point
Price is approaching the key breakout zone at ~$2.56, showing early signs of reversal
---
✅ Bullish Scenario (Potential Major Reversal)
If the daily candle closes above $2.56 with strong volume confirmation, the breakout could trigger significant upside, with potential targets as follows:
Target Resistance Levels Notes
$3.269 Minor resistance + breakout confirmation level
$4.364 Previous support turned resistance
$5.569 Key historical distribution zone
$6.927 – $8.783 Mid-term targets / potential profit zones
$15.500 Long-term ATH target if momentum continues
💡 Additional Bullish Catalysts:
Volume compression aligns with classic breakout behavior
Breakouts from such macro patterns can yield 100–300% rallies in crypto markets
❌ Bearish Scenario (Rejection or Fakeout Risk)
If the price gets rejected at the trendline near $2.56 and fails to break above:
A pullback to the $2.00 – $2.35 support zone is likely
Further selling pressure may push price down to $1.00 (major support & psychological level)
A drop below $1.00 would confirm a continuation of the downtrend, forming new lower lows
🚨 Caution: Be wary of false breakouts — especially if the breakout happens with low volume or against bearish divergences.
🧠 Trading Plan & Strategy
Conservative Entry: Wait for a confirmed breakout + retest + volume confirmation
Aggressive Entry: Enter on daily candle close above $2.56
Stop Loss (SL): Below previous support: $2.30 or tighter at $2.00
Take Profit (TP): Scale out at $3.2 – $4.3 – $5.5 – $6.9 – $8.7
🧭 Conclusion: Critical Moment for a Macro Reversal?
> BERA is at a pivotal point that could define its next major trend. A successful breakout from this long-term pattern could mark the beginning of a powerful bullish cycle.
The technical setup is solid, the breakout level is near, and the reward-to-risk ratio is highly attractive — ideal for swing traders, breakout traders, and mid-term investors.
#BERA #BERAUSDT #CryptoBreakout #FallingWedgePattern #AltcoinAnalysis
#BreakoutSetup #TechnicalAnalysis #SwingTrade #CryptoSignals
#BullishReversal
✅ Get Free Signals! Join Our Telegram Channel Here: t.me/TheCryptoNuclear
✅ Twitter: twitter.com/crypto_nuclear
✅ Join Bybit : partner.bybit.com/b/nuclearvip
✅ Benefits : Lifetime Trading Fee Discount -50%
✅ Twitter: twitter.com/crypto_nuclear
✅ Join Bybit : partner.bybit.com/b/nuclearvip
✅ Benefits : Lifetime Trading Fee Discount -50%
Declinazione di responsabilità
Le informazioni e le pubblicazioni non sono intese come, e non costituiscono, consulenza o raccomandazioni finanziarie, di investimento, di trading o di altro tipo fornite o approvate da TradingView. Per ulteriori informazioni, consultare i Termini di utilizzo.