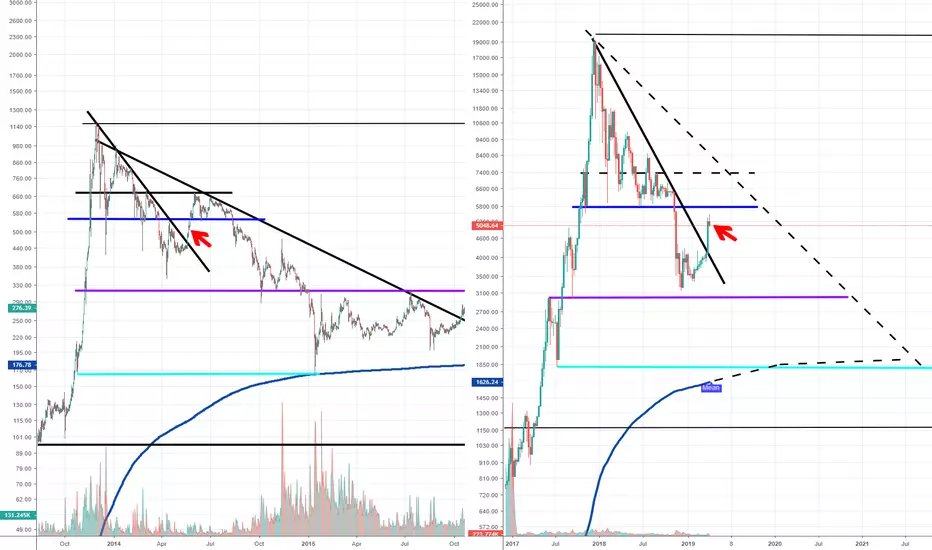
Of Course this research of only one previous bitcoin bubble does not provide very reliable data, but history tends to repeat itself on head lines.
On the short term ( 0 - 3 months ) we have bullisch potential, maybe up to the 7000's.
On the medium term ( 3 - 24 months ) it looks bearisch to around 1850 probably, when the support of juli 2017 and the all time mean cross (like in 2015).
On the long term ( 24 - 66 months ) = recovery run to 20K BTC.
And from ( 66 months - 78 months ) = next bull run mania phase from 20 K to 100K or 500K
Nota
In my opinion is the current 8,5K point very strong because similar points been compared to all other bear markets. So i am not suspecting a rise to 10K. This is enough to make everybody crazy and buy in, before we go down again. Probably we go to 6,3K, back up to 8K and than back to 6,3 K again, before we break 6,3 later this year and head back to 3K.
data.bitcoinity.org/markets/books/USD

Trade chiuso: obiettivo raggiunto
Nota
BTC went higher than i thought i would be.Declinazione di responsabilità
Le informazioni ed i contenuti pubblicati non costituiscono in alcun modo una sollecitazione ad investire o ad operare nei mercati finanziari. Non sono inoltre fornite o supportate da TradingView. Maggiori dettagli nelle Condizioni d'uso.
Declinazione di responsabilità
Le informazioni ed i contenuti pubblicati non costituiscono in alcun modo una sollecitazione ad investire o ad operare nei mercati finanziari. Non sono inoltre fornite o supportate da TradingView. Maggiori dettagli nelle Condizioni d'uso.

