BNBUSDT Weekly Chart – Full Analysis
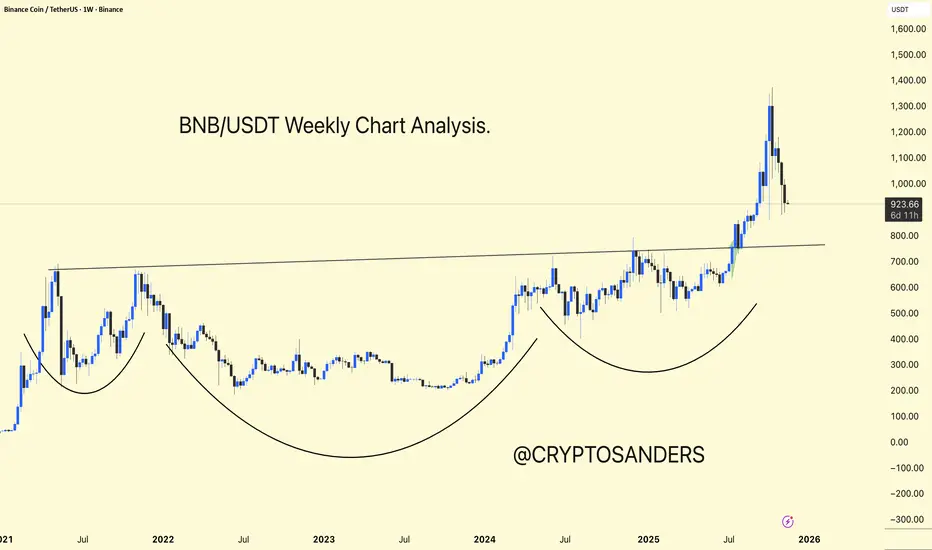
BNB is displaying a multi-year Inverse Head and Shoulders structure on the weekly chart, which is a bullish continuation pattern that indicates accumulation followed by a breakout.
Key Breakout: Horizontal resistance near $800 serves as a neckline for the pattern. BNB broke above this level with strong volume, confirming the bullish breakout and initiating a sharp uptrend.
Current Activity: After reaching above $1,300, BNB is currently retracing and testing the breakout area as support ($800–$900). This is a standard retest after a significant uptrend.
Bullish Scenario: If BNB holds $800–$900, a strong upward trend toward new all-time highs is likely, with targets potentially reaching $1,500 and above, measured using cup depth.
Bearish Risk: Losing the $800 neckline would invalidate the current breakout and could lead to a deeper retracement before another upward move.
BNB is in a strong long-term uptrend. After successfully breaking out of a massive cup-and-handle pattern, it is retesting support—a natural and healthy technical move. Holding above $800–$900 keeps BNB in a bullish setup, with further upside potential.
DYOR | NFA
Pubblicazioni correlate
Declinazione di responsabilità
Le informazioni e le pubblicazioni non sono intese come, e non costituiscono, consulenza o raccomandazioni finanziarie, di investimento, di trading o di altro tipo fornite o approvate da TradingView. Per ulteriori informazioni, consultare i Termini di utilizzo.