Is  BSOFT Technical Breakout Real? What the Charts Tell You About This Mid-Cap IT Giant's Next Move after Weaking Rupee and Strong Margins Recovery in Q2FY26. Let's Analyze in Chart of the Week.
As per the Latest SEBI Mandate, this isn't a Trading/Investment RECOMMENDATION nor for Educational Purposes; it is just for Informational purposes only. The chart data used is 3 Months old, as Showing Live Chart Data is not allowed according to the New SEBI Mandate.
Disclaimer: "I am not a SEBI REGISTERED RESEARCH ANALYST AND INVESTMENT ADVISER."
This analysis is intended solely for informational purposes and should not be interpreted as financial advice. It is advisable to consult a qualified financial advisor or conduct thorough research before making investment decisions.
Price Action Analysis:
Long-Term Trend Structure:
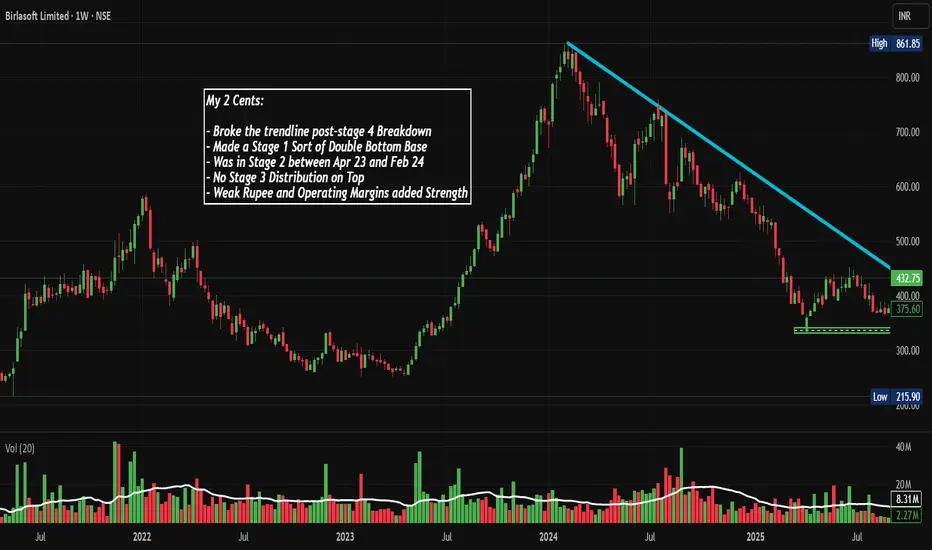
- The stock experienced a strong uptrend from early 2022 to peak levels around ₹861.85 (High) in early 2024, representing a massive rally from the ₹250-300 base
- Following the peak, Birlasoft entered a prolonged correction phase, declining from ₹861.85 to a low of ₹250.25, marking approximately 71% retracement from the top
- Currently trading at ₹432.75 as of December 6, 2025, showing a recent +13.82% bounce
- The stock has been consolidating in the ₹350-450 range for the past several months after bottoming out
Current Price Action Characteristics:
- Recent price action shows signs of accumulation near the ₹350-380 support zone
- The stock broke above a descending trendline (cyan line on the chart) which connected the highs from early 2024 through late 2025
- This trendline break suggests a potential shift in momentum from bearish to bullish
- The green horizontal box at the bottom (₹300-350 zone) appears to mark a strong demand zone where buyers stepped in aggressively
- Post-trendline breakout, the stock has shown resilience with higher lows being formed
Stage Analysis Interpretation:
- The stock broke the trendline after a Stage 4 breakdown
- Formed a Stage 1 type of double bottom base pattern
- Was in Stage 2 Uptrend between April 2023 and February 2024
- No Stage 3 distribution pattern was visible on top
- The presence of weak rupee and improving operating margins has added fundamental strength
Volume Spread Analysis:
Volume Distribution Patterns:
- The volume chart shows significant spikes during key price movements
- Major volume accumulation visible during the decline phase in late 2024 and early 2025, suggesting capitulation
- Recent volume (25.13M) is substantially higher than the average (7.84M), indicating increased participation
- Volume spikes coinciding with the recent rally from ₹350-380 levels suggest genuine buying interest
- The green volume bars in recent sessions indicate buying pressure supporting the upward move
Volume-Price Relationship:
- During the downtrend, volume increased on down days, confirming selling pressure
- At the bottom formation (₹300-350 zone), volume remained elevated but price held ground - classic accumulation behavior
- The breakout from the descending trendline came with above-average volume, validating the move
- Current volume levels suggest institutional interest is returning to the stock
Base Formation and Support Levels:
Base Structure:
- A clear double bottom pattern formed at approximately ₹350-380 levels
- The base formation period spans from mid-2025 to current levels
- This base represents a 5-7 month consolidation, allowing weak hands to exit and strong hands to accumulate
- The green box marked on the chart (₹300-350) represents the primary support zone
Key Support Levels:
- Immediate support: ₹380-400 (previous resistance turned support)
- Strong support: ₹350-365 (double bottom lows)
- Critical support: ₹300-320 (absolute base of consolidation)
- The 52-week low at ₹250.25 acts as a psychological support level
Support Significance:
- The ₹350-380 zone has been tested multiple times and held firm, indicating strong buying interest
- Volume accumulation in this zone suggests institutional accumulation
- Any pullback toward ₹380-400 would be a retest opportunity for the breakout
Resistance Levels:
Immediate Resistance Zones:
- First resistance: ₹450-460 (previous consolidation highs)
- Second resistance: ₹500-520 (psychological level and minor supply zone)
- Major resistance: ₹600-650 (significant supply zone from the downtrend)
- Ultimate resistance: ₹750-800 (prior distribution zone before major correction)
Resistance Analysis:
- The descending trendline, now broken, may act as dynamic support on pullbacks
- The ₹450 level represents a minor hurdle but has been approached multiple times recently
- Breaking above ₹500 would confirm the bullish structure and potentially trigger momentum buying
- The journey to ₹600+ would require sustained buying and improvement in business fundamentals
Technical Patterns:
- Double Bottom Pattern: Clearly visible at ₹350-380 levels with two distinct lows
- Descending Trendline Breakout: The cyan trendline connecting lower highs has been decisively broken
- Rounding Bottom Formation: The overall structure from the peak shows a gradual rounding bottom (Not a Textbook Kind)
- Higher Low Pattern: Recent price action shows formation of higher lows post-breakout (on Lower TF)
Pattern Implications:
- Double bottom patterns typically indicate trend reversal
- The trendline breakout adds conviction to the bullish thesis
- Continuation patterns forming above ₹400 would strengthen the uptrend structure
Risk Considerations:
- Failure to hold above the descending trendline (now support at ₹400-410) would negate the bullish setup
- A break below ₹380 would signal renewed weakness
- The stock must close above ₹450 on good volume to confirm the breakout
Sectoral Backdrop - Indian IT Services Industry:
Current Industry Landscape:
- The Indian IT sector is navigating a challenging demand environment with 77% of providers expecting higher business growth in FY26 compared to last year, driven by growing foundational digital scope, emerging markets, and strategic AI-led demand
- IT exports are expected to cross the $200 billion mark, growing 4.6% year-over-year to reach $224 billion in FY25
- The sector faces uncertainty due to global macroeconomic conditions, with clients delaying discretionary technology spending
- However, IT spending in India is expected to rise 11.1% year-on-year to $161.5 billion in 2025
Emerging Trends and Opportunities:
- AI and digital transformation continue to be major growth drivers across the industry
- Overall IT hiring grew 16% year-over-year in April 2025, driven by AI adoption, cloud modernization, and rapid expansion of Global Capability Centres
- Non-metro cities like Udaipur, Vizag, Coimbatore, and Nagpur are experiencing over 50% IT hiring growth
- Mid-tier IT companies have shown better agility in navigating uncertain macroeconomic conditions compared to larger counterparts
Sector Challenges:
- The sector faces its eighth consecutive quarter of single-digit revenue growth, with weak client spending and reduced digital transformation budgets as main culprits
- Rising H-1B visa fees and Trump tariffs are creating indirect headwinds for the industry
- Life sciences and manufacturing verticals are experiencing softness
- Margin pressures from rising wages, talent shortages, and shift to more onsite work models
Fundamental Backdrop:
Business Overview:
- Birlasoft Limited provides cloud, artificial intelligence (AI), and digital technologies, combining domain expertise with enterprise solutions across banking, financial services, insurance, life sciences, energy resources, utilities, and manufacturing verticals
- The company offers services in customer experience, data analytics, connected products, intelligent automation, blockchain, and generative AI
- In fiscal year 2025, the company achieved consolidated revenue of ₹53,752 million, with the Americas contributing 86.5% of total revenue
- Part of the CK Birla Group, bringing strong promoter backing and group pedigree
Recent Financial Performance:
- Q2 FY25 revenue was $163.3 million, showing 3.1% sequential growth in rupee terms and 2.6% in dollar terms, with year-over-year growth of 4.5%
- Q3 FY25 revenue reached ₹1,383.48 crore, up 0.9% year-over-year but down 1.29% quarter-over-quarter
- EBITDA margin dropped to 12.1% in Q2 FY25 from 14.7% in the previous quarter, partly due to pricing flexibility and increased on-site work
- Net profit was ₹116.10 crore in Q2 FY26, down 8.95% year-over-year but showing 9.09% sequential growth
Operational Highlights:
- The company delivered approximately $300 million in deal signings in the first half of FY25, though lower than the previous year
- Cash and bank balance stood at $221.8 million with operating cash flow of $12.9 million
- Days sales outstanding (DSO) at 58 days remains among the best in the industry
- Workforce strength of approximately 12,500+ professionals with attrition improving to around 11.8%
Key Challenges:
- Life sciences vertical has been underperforming and is expected to remain soft for a couple more quarters
- Manufacturing vertical, the company's largest, experienced project closures and ramp-downs
- Shift in revenue mix toward 51% onsite work has pressured margins
- Customer decision-making delays have affected deal flow and total contract value performance
Positive Catalysts:
- Three of four verticals (BFSI, Life Sciences & Services, Energy & Utilities) delivered sequential growth in Q2
- Management indicates improving pipeline with expectations of better deal flow in H2
- Recent AWS competency achievements in Manufacturing and Industrial Consulting enhance credibility
- CEO Angan Guha's reappointment for another two-year term provides leadership continuity
- Weak rupee environment provides tailwinds for export-oriented revenue
- Focus on improving operational efficiency and margin expansion through offshore shift
Valuation Context:
- Market capitalization stands at approximately ₹10,816 crore
- The stock has corrected significantly from highs, potentially offering better risk-reward at current levels
- P/E multiple compression during the correction phase may present opportunity if earnings stabilize
Overall Technical Assessment:
- The stock has completed a multi-month base formation and broken above a critical descending trendline
- Volume confirmation on the breakout adds credibility to the move
- The double bottom pattern at ₹350-380 provides a well-defined risk level for traders
- Risk-reward ratio favors bulls with clear support and resistance levels
Bull Case:
- A decisive close above ₹500 would open doors for ₹600+ levels
- Improving business fundamentals and sectoral recovery would support the technical breakout
Bear Case:
- Failure to hold the breakout level (₹400-410) would indicate a false breakout
- A breach below ₹380 would negate the bullish setup and potentially retest the ₹350 base
- Weak quarterly results or deteriorating sector conditions could trigger profit booking
My 2 Cents:
BSOFT presents an interesting technical setup after a prolonged correction. The completion of a double bottom base formation, coupled with a descending trendline breakout on good volume, suggests the worst may be behind for the stock. While fundamental challenges persist in the form of muted demand environment and margin pressures, the company's focus on operational efficiency, improving deal pipeline, and sector positioning in high-growth areas like AI and cloud provide reasons for optimism.
The technical structure suggests that patient accumulation in the current range with strict risk management could be rewarded if the company executes on its operational plans and the broader IT sector demand improves. However, investors should remain cognizant of the challenging macroeconomic backdrop and monitor quarterly results closely for signs of sustainable business improvement.
The confluence of technical breakout and improving operational metrics makes Birlasoft a stock worth watching for both tactical trades and strategic accumulation, provided risk management principles are strictly followed.
Full Coverage on my Newsletter this Week
Keep in the Watchlist and DOYR.
NO RECO. For Buy/Sell.
📌Thank you for exploring my idea! I hope you found it valuable.
🙏FOLLOW for more
👍BOOST if you found it useful.
✍️COMMENT below with your views.
Meanwhile, check out my other stock ideas on the right side until this trade is activated. I would love your feedback.
As per the Latest SEBI Mandate, this isn't a Trading/Investment RECOMMENDATION nor for Educational Purposes; it is just for Informational purposes only. The chart data used is 3 Months old, as Showing Live Chart Data is not allowed according to the New SEBI Mandate.
Disclaimer: "I am not a SEBI REGISTERED RESEARCH ANALYST AND INVESTMENT ADVISER."
This analysis is intended solely for informational purposes and should not be interpreted as financial advice. It is advisable to consult a qualified financial advisor or conduct thorough research before making investment decisions.
Price Action Analysis:
Long-Term Trend Structure:
- The stock experienced a strong uptrend from early 2022 to peak levels around ₹861.85 (High) in early 2024, representing a massive rally from the ₹250-300 base
- Following the peak, Birlasoft entered a prolonged correction phase, declining from ₹861.85 to a low of ₹250.25, marking approximately 71% retracement from the top
- Currently trading at ₹432.75 as of December 6, 2025, showing a recent +13.82% bounce
- The stock has been consolidating in the ₹350-450 range for the past several months after bottoming out
Current Price Action Characteristics:
- Recent price action shows signs of accumulation near the ₹350-380 support zone
- The stock broke above a descending trendline (cyan line on the chart) which connected the highs from early 2024 through late 2025
- This trendline break suggests a potential shift in momentum from bearish to bullish
- The green horizontal box at the bottom (₹300-350 zone) appears to mark a strong demand zone where buyers stepped in aggressively
- Post-trendline breakout, the stock has shown resilience with higher lows being formed
Stage Analysis Interpretation:
- The stock broke the trendline after a Stage 4 breakdown
- Formed a Stage 1 type of double bottom base pattern
- Was in Stage 2 Uptrend between April 2023 and February 2024
- No Stage 3 distribution pattern was visible on top
- The presence of weak rupee and improving operating margins has added fundamental strength
Volume Spread Analysis:
Volume Distribution Patterns:
- The volume chart shows significant spikes during key price movements
- Major volume accumulation visible during the decline phase in late 2024 and early 2025, suggesting capitulation
- Recent volume (25.13M) is substantially higher than the average (7.84M), indicating increased participation
- Volume spikes coinciding with the recent rally from ₹350-380 levels suggest genuine buying interest
- The green volume bars in recent sessions indicate buying pressure supporting the upward move
Volume-Price Relationship:
- During the downtrend, volume increased on down days, confirming selling pressure
- At the bottom formation (₹300-350 zone), volume remained elevated but price held ground - classic accumulation behavior
- The breakout from the descending trendline came with above-average volume, validating the move
- Current volume levels suggest institutional interest is returning to the stock
Base Formation and Support Levels:
Base Structure:
- A clear double bottom pattern formed at approximately ₹350-380 levels
- The base formation period spans from mid-2025 to current levels
- This base represents a 5-7 month consolidation, allowing weak hands to exit and strong hands to accumulate
- The green box marked on the chart (₹300-350) represents the primary support zone
Key Support Levels:
- Immediate support: ₹380-400 (previous resistance turned support)
- Strong support: ₹350-365 (double bottom lows)
- Critical support: ₹300-320 (absolute base of consolidation)
- The 52-week low at ₹250.25 acts as a psychological support level
Support Significance:
- The ₹350-380 zone has been tested multiple times and held firm, indicating strong buying interest
- Volume accumulation in this zone suggests institutional accumulation
- Any pullback toward ₹380-400 would be a retest opportunity for the breakout
Resistance Levels:
Immediate Resistance Zones:
- First resistance: ₹450-460 (previous consolidation highs)
- Second resistance: ₹500-520 (psychological level and minor supply zone)
- Major resistance: ₹600-650 (significant supply zone from the downtrend)
- Ultimate resistance: ₹750-800 (prior distribution zone before major correction)
Resistance Analysis:
- The descending trendline, now broken, may act as dynamic support on pullbacks
- The ₹450 level represents a minor hurdle but has been approached multiple times recently
- Breaking above ₹500 would confirm the bullish structure and potentially trigger momentum buying
- The journey to ₹600+ would require sustained buying and improvement in business fundamentals
Technical Patterns:
- Double Bottom Pattern: Clearly visible at ₹350-380 levels with two distinct lows
- Descending Trendline Breakout: The cyan trendline connecting lower highs has been decisively broken
- Rounding Bottom Formation: The overall structure from the peak shows a gradual rounding bottom (Not a Textbook Kind)
- Higher Low Pattern: Recent price action shows formation of higher lows post-breakout (on Lower TF)
Pattern Implications:
- Double bottom patterns typically indicate trend reversal
- The trendline breakout adds conviction to the bullish thesis
- Continuation patterns forming above ₹400 would strengthen the uptrend structure
Risk Considerations:
- Failure to hold above the descending trendline (now support at ₹400-410) would negate the bullish setup
- A break below ₹380 would signal renewed weakness
- The stock must close above ₹450 on good volume to confirm the breakout
Sectoral Backdrop - Indian IT Services Industry:
Current Industry Landscape:
- The Indian IT sector is navigating a challenging demand environment with 77% of providers expecting higher business growth in FY26 compared to last year, driven by growing foundational digital scope, emerging markets, and strategic AI-led demand
- IT exports are expected to cross the $200 billion mark, growing 4.6% year-over-year to reach $224 billion in FY25
- The sector faces uncertainty due to global macroeconomic conditions, with clients delaying discretionary technology spending
- However, IT spending in India is expected to rise 11.1% year-on-year to $161.5 billion in 2025
Emerging Trends and Opportunities:
- AI and digital transformation continue to be major growth drivers across the industry
- Overall IT hiring grew 16% year-over-year in April 2025, driven by AI adoption, cloud modernization, and rapid expansion of Global Capability Centres
- Non-metro cities like Udaipur, Vizag, Coimbatore, and Nagpur are experiencing over 50% IT hiring growth
- Mid-tier IT companies have shown better agility in navigating uncertain macroeconomic conditions compared to larger counterparts
Sector Challenges:
- The sector faces its eighth consecutive quarter of single-digit revenue growth, with weak client spending and reduced digital transformation budgets as main culprits
- Rising H-1B visa fees and Trump tariffs are creating indirect headwinds for the industry
- Life sciences and manufacturing verticals are experiencing softness
- Margin pressures from rising wages, talent shortages, and shift to more onsite work models
Fundamental Backdrop:
Business Overview:
- Birlasoft Limited provides cloud, artificial intelligence (AI), and digital technologies, combining domain expertise with enterprise solutions across banking, financial services, insurance, life sciences, energy resources, utilities, and manufacturing verticals
- The company offers services in customer experience, data analytics, connected products, intelligent automation, blockchain, and generative AI
- In fiscal year 2025, the company achieved consolidated revenue of ₹53,752 million, with the Americas contributing 86.5% of total revenue
- Part of the CK Birla Group, bringing strong promoter backing and group pedigree
Recent Financial Performance:
- Q2 FY25 revenue was $163.3 million, showing 3.1% sequential growth in rupee terms and 2.6% in dollar terms, with year-over-year growth of 4.5%
- Q3 FY25 revenue reached ₹1,383.48 crore, up 0.9% year-over-year but down 1.29% quarter-over-quarter
- EBITDA margin dropped to 12.1% in Q2 FY25 from 14.7% in the previous quarter, partly due to pricing flexibility and increased on-site work
- Net profit was ₹116.10 crore in Q2 FY26, down 8.95% year-over-year but showing 9.09% sequential growth
Operational Highlights:
- The company delivered approximately $300 million in deal signings in the first half of FY25, though lower than the previous year
- Cash and bank balance stood at $221.8 million with operating cash flow of $12.9 million
- Days sales outstanding (DSO) at 58 days remains among the best in the industry
- Workforce strength of approximately 12,500+ professionals with attrition improving to around 11.8%
Key Challenges:
- Life sciences vertical has been underperforming and is expected to remain soft for a couple more quarters
- Manufacturing vertical, the company's largest, experienced project closures and ramp-downs
- Shift in revenue mix toward 51% onsite work has pressured margins
- Customer decision-making delays have affected deal flow and total contract value performance
Positive Catalysts:
- Three of four verticals (BFSI, Life Sciences & Services, Energy & Utilities) delivered sequential growth in Q2
- Management indicates improving pipeline with expectations of better deal flow in H2
- Recent AWS competency achievements in Manufacturing and Industrial Consulting enhance credibility
- CEO Angan Guha's reappointment for another two-year term provides leadership continuity
- Weak rupee environment provides tailwinds for export-oriented revenue
- Focus on improving operational efficiency and margin expansion through offshore shift
Valuation Context:
- Market capitalization stands at approximately ₹10,816 crore
- The stock has corrected significantly from highs, potentially offering better risk-reward at current levels
- P/E multiple compression during the correction phase may present opportunity if earnings stabilize
Overall Technical Assessment:
- The stock has completed a multi-month base formation and broken above a critical descending trendline
- Volume confirmation on the breakout adds credibility to the move
- The double bottom pattern at ₹350-380 provides a well-defined risk level for traders
- Risk-reward ratio favors bulls with clear support and resistance levels
Bull Case:
- A decisive close above ₹500 would open doors for ₹600+ levels
- Improving business fundamentals and sectoral recovery would support the technical breakout
Bear Case:
- Failure to hold the breakout level (₹400-410) would indicate a false breakout
- A breach below ₹380 would negate the bullish setup and potentially retest the ₹350 base
- Weak quarterly results or deteriorating sector conditions could trigger profit booking
My 2 Cents:
The technical structure suggests that patient accumulation in the current range with strict risk management could be rewarded if the company executes on its operational plans and the broader IT sector demand improves. However, investors should remain cognizant of the challenging macroeconomic backdrop and monitor quarterly results closely for signs of sustainable business improvement.
The confluence of technical breakout and improving operational metrics makes Birlasoft a stock worth watching for both tactical trades and strategic accumulation, provided risk management principles are strictly followed.
Full Coverage on my Newsletter this Week
Keep in the Watchlist and DOYR.
NO RECO. For Buy/Sell.
📌Thank you for exploring my idea! I hope you found it valuable.
🙏FOLLOW for more
👍BOOST if you found it useful.
✍️COMMENT below with your views.
Meanwhile, check out my other stock ideas on the right side until this trade is activated. I would love your feedback.
As per the Latest SEBI Mandate, this isn't a Trading/Investment RECOMMENDATION nor for Educational Purposes; it is just for Informational purposes only. The chart data used is 3 Months old, as Showing Live Chart Data is not allowed according to the New SEBI Mandate.
Disclaimer: "I am not a SEBI REGISTERED RESEARCH ANALYST AND INVESTMENT ADVISER."
This analysis is intended solely for informational purposes and should not be interpreted as financial advice. It is advisable to consult a qualified financial advisor or conduct thorough research before making investment decisions.
Pubblicazioni correlate
Declinazione di responsabilità
Le informazioni e le pubblicazioni non sono intese come, e non costituiscono, consulenza o raccomandazioni finanziarie, di investimento, di trading o di altro tipo fornite o approvate da TradingView. Per ulteriori informazioni, consultare i Termini di utilizzo.