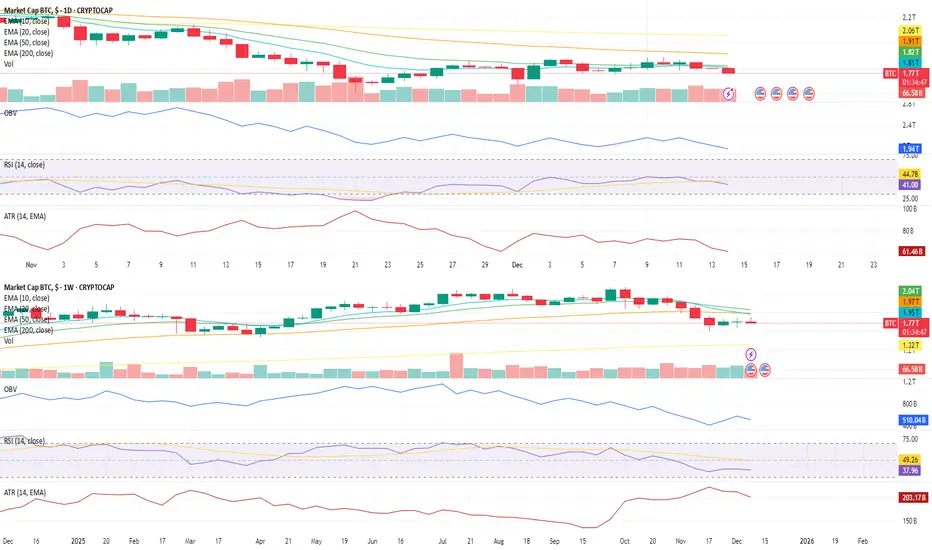
1D Chart (Daily)
Bitcoin’s short-term structure remains under pressure, with price trading below the 20 EMA, which is currently holding flat and steady rather than accelerating. This suggests a market that is pausing rather than aggressively trending.
EMA structure: Price below the 20 EMA, with the average flattening rather than expanding.
OBV: Slight downward drift, indicating modest distribution rather than panic selling.
RSI: Trending marginally lower, reflecting softening momentum without capitulation.
ATR: Flat, signaling stable volatility conditions and an absence of emotional price movement.
Overall, the daily chart reflects controlled weakness and consolidation rather than disorder.
1W Chart (Weekly)
The weekly timeframe continues to show a more pronounced structural headwind.
EMA structure: Price remains below key EMAs, with averages pointing downward, confirming broader trend pressure.
OBV: Gradually declining, suggesting reduced participation and cautious positioning.
RSI: Trending lower and holding steady, reinforcing subdued momentum.
ATR: Flat, indicating volatility remains contained even as trend pressure persists.
The weekly structure confirms that BTC is still digesting prior downside, with no volatility expansion signaling forced liquidation or acceleration.
Overall Takeaway
Across both timeframes, Bitcoin remains in a structured pullback phase. Weakness is present, but it is orderly, with stable volatility and no signs of panic behavior. Momentum indicators suggest pressure remains, yet the lack of ATR expansion implies the market is consolidating rather than breaking down.
⭐ Final Clarity Note ⭐
When volatility stays flat during periods of weakness, structure often matters more than price headlines. Declining momentum paired with steady ATR typically reflects positioning and digestion, not emotional exits. Markets often stabilize before they turn — and structure quietly reveals whether pressure is deteriorating or simply maturing.
Declinazione di responsabilità
Le informazioni e le pubblicazioni non sono intese come, e non costituiscono, consulenza o raccomandazioni finanziarie, di investimento, di trading o di altro tipo fornite o approvate da TradingView. Per ulteriori informazioni, consultare i Termini di utilizzo.
Declinazione di responsabilità
Le informazioni e le pubblicazioni non sono intese come, e non costituiscono, consulenza o raccomandazioni finanziarie, di investimento, di trading o di altro tipo fornite o approvate da TradingView. Per ulteriori informazioni, consultare i Termini di utilizzo.