Chart Analysis
1. The Recent Unfilled Gap:
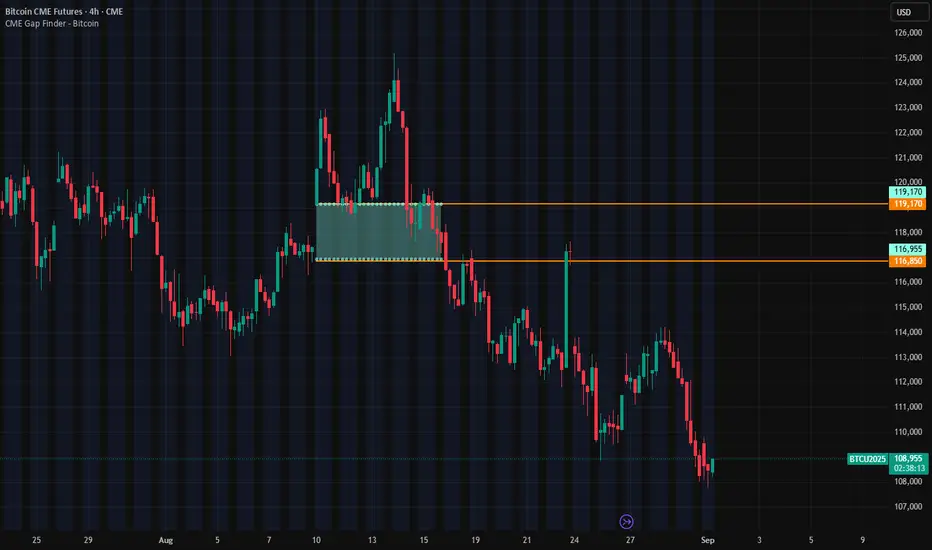
Location: In the top right section of the chart, there is a downward gap.
Price: This gap is situated between the two orange lines, in the price range of $116,050 to $119,170.
Current Status: As the chart shows, the current Bitcoin price is around $108,720, and this gap remains unfilled. This suggests that the price may have a tendency to move upwards to fill this gap in the future.
2. The Previous Filled Gap:
Location: A smaller gap is visible on the left side of the chart.
Current Status: This gap has already been filled, which means the price returned to that level at some point and closed the gap.
Key Takeaways
Overall Trend: The chart indicates that after reaching a high of approximately $124,000, the price has entered a corrective and downward trend.
Importance of Gaps: CME gaps are considered key levels in technical analysis. The current unfilled gap could act as a potential resistance, but many traders view it as a price target and expect the price to eventually reach that level.
In summary, this chart clearly shows a large, unfilled gap above the current Bitcoin price, which could influence the future price movement.
1. The Recent Unfilled Gap:
Location: In the top right section of the chart, there is a downward gap.
Price: This gap is situated between the two orange lines, in the price range of $116,050 to $119,170.
Current Status: As the chart shows, the current Bitcoin price is around $108,720, and this gap remains unfilled. This suggests that the price may have a tendency to move upwards to fill this gap in the future.
2. The Previous Filled Gap:
Location: A smaller gap is visible on the left side of the chart.
Current Status: This gap has already been filled, which means the price returned to that level at some point and closed the gap.
Key Takeaways
Overall Trend: The chart indicates that after reaching a high of approximately $124,000, the price has entered a corrective and downward trend.
Importance of Gaps: CME gaps are considered key levels in technical analysis. The current unfilled gap could act as a potential resistance, but many traders view it as a price target and expect the price to eventually reach that level.
In summary, this chart clearly shows a large, unfilled gap above the current Bitcoin price, which could influence the future price movement.
Declinazione di responsabilità
Le informazioni e le pubblicazioni non sono intese come, e non costituiscono, consulenza o raccomandazioni finanziarie, di investimento, di trading o di altro tipo fornite o approvate da TradingView. Per ulteriori informazioni, consultare i Termini di utilizzo.
Declinazione di responsabilità
Le informazioni e le pubblicazioni non sono intese come, e non costituiscono, consulenza o raccomandazioni finanziarie, di investimento, di trading o di altro tipo fornite o approvate da TradingView. Per ulteriori informazioni, consultare i Termini di utilizzo.