Hello
It's a Bitcoin Guide.
If you "follow"
You can receive real-time movement paths and comment notifications on major sections.
If my analysis was helpful,
Please click the booster button at the bottom.

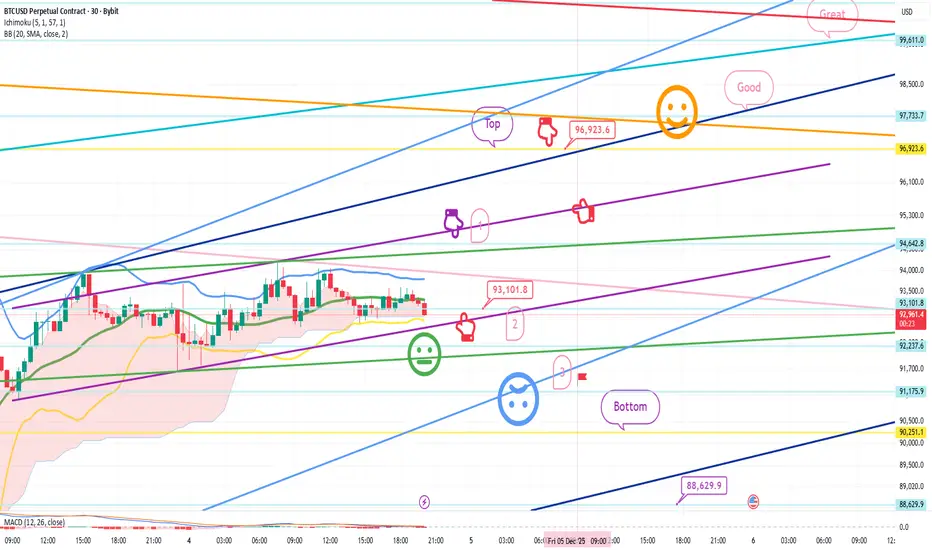
This is a 30-minute Bitcoin chart.
It's not visible on the screen due to limited space,
but at the bottom, it touched the long position entry point of $83,495.4 on December 1st,
and continues to rise.
The Nasdaq indicators will be released shortly at 10:30 AM,
and I developed today's strategy based on the Nasdaq and Tether dominance patterns.
*Conditional long position strategy based on the red finger's path
1. After touching the purple section once at the top (autonomous short)
Switch to a long position at the red finger at the bottom at $93,101.8
/Stop-loss price if the green support line is broken
2. First target for a long position at the top section at $96,923.6 -> Target prices in the order of Good and Great
Before tomorrow's daily candlestick is created,
if the top section is touched alone,
since it is a resistance line on the Bollinger Band daily chart,
a strong correction is likely.
If the Good section is touched at once,
it is highly likely to be ignored and continue to rise.
If the price drops immediately without touching the first section at the top,
it's a final long strategy in the second section,
and the stop-loss price remains the same.
The third section below is a sideways movement.
If the green support line holds today, a vertical rise is possible after tomorrow.
If the price holds today's light blue support line,
it could lead to a strong upward movement after tomorrow.
Below the bottom, the price is open to 88.6K, the lowest point today.
Please note this.
Please use my analysis to this point for reference only.
I hope you operate safely, adhering to principled trading and a stop-loss price.
Thank you.
It's a Bitcoin Guide.
If you "follow"
You can receive real-time movement paths and comment notifications on major sections.
If my analysis was helpful,
Please click the booster button at the bottom.
This is a 30-minute Bitcoin chart.
It's not visible on the screen due to limited space,
but at the bottom, it touched the long position entry point of $83,495.4 on December 1st,
and continues to rise.
The Nasdaq indicators will be released shortly at 10:30 AM,
and I developed today's strategy based on the Nasdaq and Tether dominance patterns.
*Conditional long position strategy based on the red finger's path
1. After touching the purple section once at the top (autonomous short)
Switch to a long position at the red finger at the bottom at $93,101.8
/Stop-loss price if the green support line is broken
2. First target for a long position at the top section at $96,923.6 -> Target prices in the order of Good and Great
Before tomorrow's daily candlestick is created,
if the top section is touched alone,
since it is a resistance line on the Bollinger Band daily chart,
a strong correction is likely.
If the Good section is touched at once,
it is highly likely to be ignored and continue to rise.
If the price drops immediately without touching the first section at the top,
it's a final long strategy in the second section,
and the stop-loss price remains the same.
The third section below is a sideways movement.
If the green support line holds today, a vertical rise is possible after tomorrow.
If the price holds today's light blue support line,
it could lead to a strong upward movement after tomorrow.
Below the bottom, the price is open to 88.6K, the lowest point today.
Please note this.
Please use my analysis to this point for reference only.
I hope you operate safely, adhering to principled trading and a stop-loss price.
Thank you.
Trade attivo
Hello,It's a Bitcoin Guide.
I'll check the movement since writing the analysis on December 4th.
This is a 30-minute chart for the Nasdaq.
I've marked the key periods with black fingers.
Recently, I haven't been analyzing the Nasdaq,
but rather focusing on patterns for Bitcoin analysis.
Yesterday, a gap formed in the middle,
and after touching the bottom, the price closed in a very sideways pattern.
Today, another daily candle was formed and a rebound is underway.
Yesterday's movement continues to break the mid-term pattern
(the Bollinger Bands 6-hour chart's center line touched alone).
It's rising in steps,
but I'm afraid a sudden correction could occur.
This is a 30-minute chart for Bitcoin.
I've marked the key periods with black fingers.
Yesterday, in the conditional red long position strategy,
the purple finger didn't touch the first section at the top,
so I placed a long position (2) at the bottom.
After touching the long position entry point (2) at $92,237.6,
it fell to section 3,
then touched the light blue support line I've marked, and then broke the green support line,
ending in a sharp sideways movement.
It's currently trading sideways near the second entry point.
The strategy is active.
Since I've analyzed the charts,
I need to finish it without changing my perspective, right?
Yesterday's movement marked a MACD dead cross on the 4-hour chart,
and the Bollinger Bands are touching the center line of the 4-hour chart.
With no movement, perfect moves aren't easily achieved.
The Nasdaq is volatile and difficult these days.
For those holding long positions,
please refer to the prices listed below.
I hope you'll manage your positions well, with a clear focus on principle trading and stop-loss orders.
Thank you.
*비트코인가이드 공식텔레그램 Telegram
t.me/BTG_Group
*빙엑스 BingX 50%DC+$5,000 (총1회수수료)
bingx.com/invite/YBM3A4
*바이비트 Bybit 20%DC+$5,020
partner.bybit.com/b/Bitcoin_Guide
*앞으로는 하단의 네이버카페에서만 활동합니다.
cafe.naver.com/loanlife82
t.me/BTG_Group
*빙엑스 BingX 50%DC+$5,000 (총1회수수료)
bingx.com/invite/YBM3A4
*바이비트 Bybit 20%DC+$5,020
partner.bybit.com/b/Bitcoin_Guide
*앞으로는 하단의 네이버카페에서만 활동합니다.
cafe.naver.com/loanlife82
Pubblicazioni correlate
Declinazione di responsabilità
Le informazioni e le pubblicazioni non sono intese come, e non costituiscono, consulenza o raccomandazioni finanziarie, di investimento, di trading o di altro tipo fornite o approvate da TradingView. Per ulteriori informazioni, consultare i Termini di utilizzo.