BTC/USDT – 1D Chart Analysis
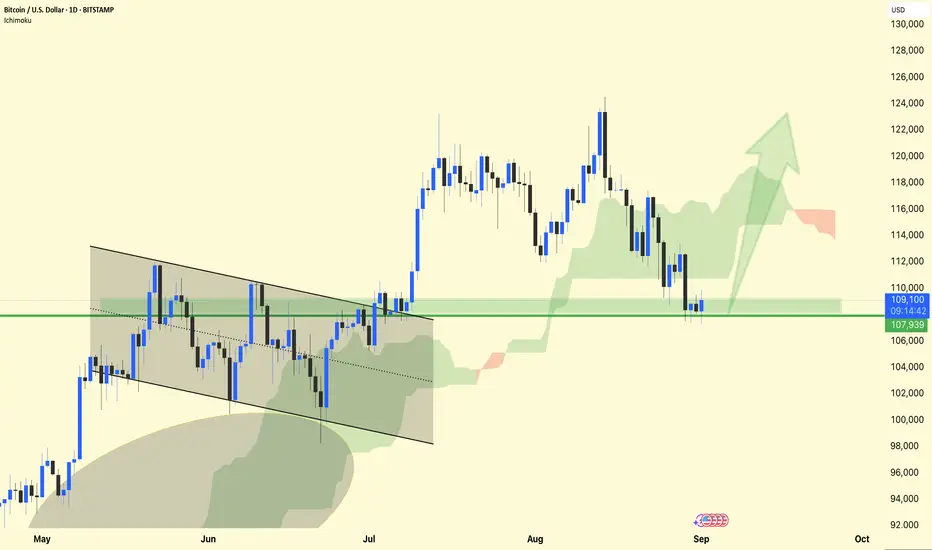
BTC is holding above the $108K support zone (green box). This area has acted as a demand zone, preventing deeper downside.
Structure: After the breakdown from the wedge pattern earlier, the price is consolidating near support with lower wicks showing buyer defense.
Ichimoku Cloud: Price is still inside the cloud zone, suggesting a neutral-to-bullish outlook. A strong daily close above $110K–112K could flip momentum upward.
Next Targets:
Bullish breakout → Move toward $116K – $120K zone (green arrow projection).
If support fails → Risk of retest around $104K – $102K.
⚡ Sentiment: Market is at a make-or-break level — holding $108K could spark a strong rebound; losing it could trigger further correction.
DYOR | NFA
Pubblicazioni correlate
Declinazione di responsabilità
Le informazioni e le pubblicazioni non sono intese come, e non costituiscono, consulenza o raccomandazioni finanziarie, di investimento, di trading o di altro tipo fornite o approvate da TradingView. Per ulteriori informazioni, consultare i Termini di utilizzo.