Bitcoin Rising Wedge Pattern – Daily Chart Analysis
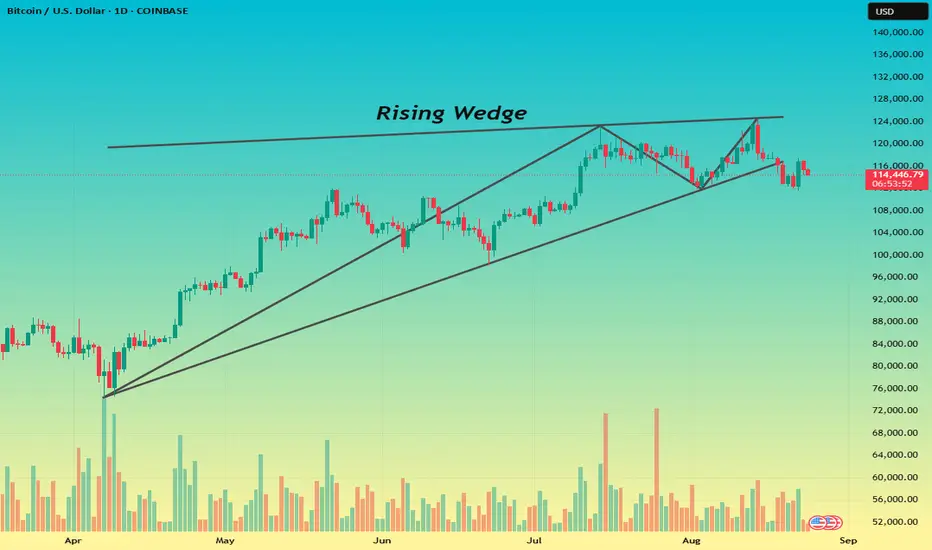
🔹Bitcoin (BTC/USD) forming a Rising Wedge pattern, which is typically considered a bearish reversal pattern
Pattern Formation
Price has been making higher highs and higher lows, but the slope of the highs is flattening compared to the slope of the lows.
This indicates weakening bullish momentum.
Breakdown Signs
BTC broke below the lower wedge support, confirming a bearish breakdown.
Current price action is retesting around $114,000 – $116,000, acting as a possible resistance zone.
Notice the declining volume during the wedge formation, which strengthens the validity of the pattern.
A spike in volume during the breakdown adds further confirmation.
Target Levels
If the breakdown sustains, potential bearish targets could be around:
$108,000 (immediate support)
$100,000 (psychological level & major support)
On the upside, if BTC reclaims $120,000, the bearish outlook weakens.
Declinazione di responsabilità
Le informazioni ed i contenuti pubblicati non costituiscono in alcun modo una sollecitazione ad investire o ad operare nei mercati finanziari. Non sono inoltre fornite o supportate da TradingView. Maggiori dettagli nelle Condizioni d'uso.
Declinazione di responsabilità
Le informazioni ed i contenuti pubblicati non costituiscono in alcun modo una sollecitazione ad investire o ad operare nei mercati finanziari. Non sono inoltre fornite o supportate da TradingView. Maggiori dettagli nelle Condizioni d'uso.