Overall Structure
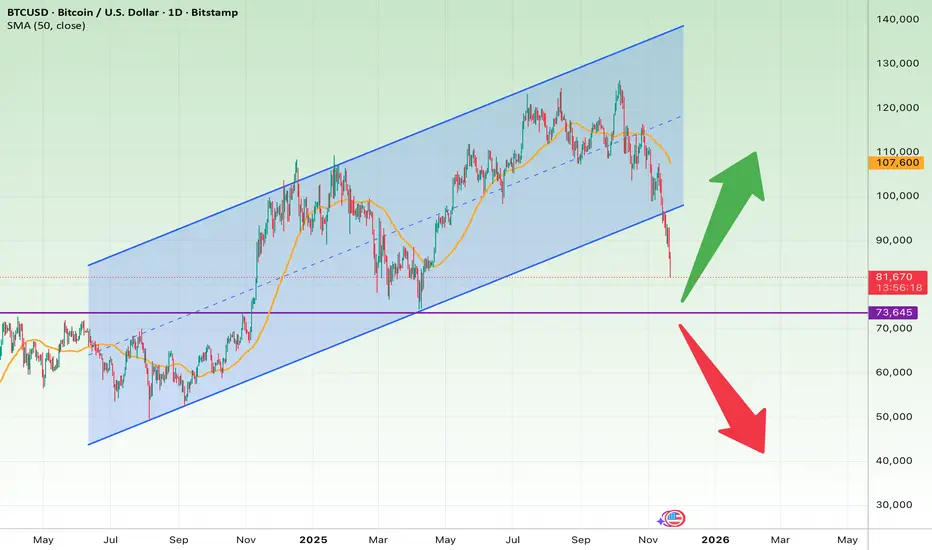
BTC has been trading inside a multi-month ascending channel, but the recent breakdown has pushed price below the lower boundary — a significant technical event.
Price is now hovering around 82,000, sitting between two major levels.
Bearish Signals
1. Breakdown from Ascending Channel
• BTC has clearly broken below the rising channel that guided price throughout 2024–2025.
• This typically signals a shift from bullish structure to mid-term bearish momentum.
2. 50-Day SMA Turning Downward
• The 50 SMA is rolling over, confirming weakening trend strength.
3. Next Major Support
• $73,645 (purple line) is the first strong horizontal demand zone.
• If this breaks, BTC will likely target:
• $52,800 (major structural support)
• This also aligns with the lower dotted horizontal structure.
Bullish Possibilities
A bullish reversal becomes viable ONLY if:
1. BTC reclaims the channel
• Price must break back above $107,600 to return inside the ascending trend.
• This would invalidate the breakdown and could trigger a new leg up.
2. Strong Reaction at $73,645
• The purple zone is the main place bulls are likely to defend.
Bullish Scenario (Green Arrow)
If BTC holds above $73,645 and pushes upward:
Targets:
1. $107,600 — reclaiming the channel
2. $120,000 – $130,000 — upper channel resistance (if fully recovered)
Bearish Scenario (Red Arrow)
If BTC loses the $73,645 support:
Targets:
1. $52,800 — major structural support
2. If deeper panic emerges, even $40,000–45,000 becomes possible (not shown but structurally valid)
Summary
• Trend: Turning bearish after channel breakdown
• Critical Support: $73,645
• Bullish Trigger: Break above $107,600
• Bearish Trigger: Break below $73,645 → $52,800
Declinazione di responsabilità
Le informazioni e le pubblicazioni non sono intese come, e non costituiscono, consulenza o raccomandazioni finanziarie, di investimento, di trading o di altro tipo fornite o approvate da TradingView. Per ulteriori informazioni, consultare i Termini di utilizzo.
Declinazione di responsabilità
Le informazioni e le pubblicazioni non sono intese come, e non costituiscono, consulenza o raccomandazioni finanziarie, di investimento, di trading o di altro tipo fornite o approvate da TradingView. Per ulteriori informazioni, consultare i Termini di utilizzo.