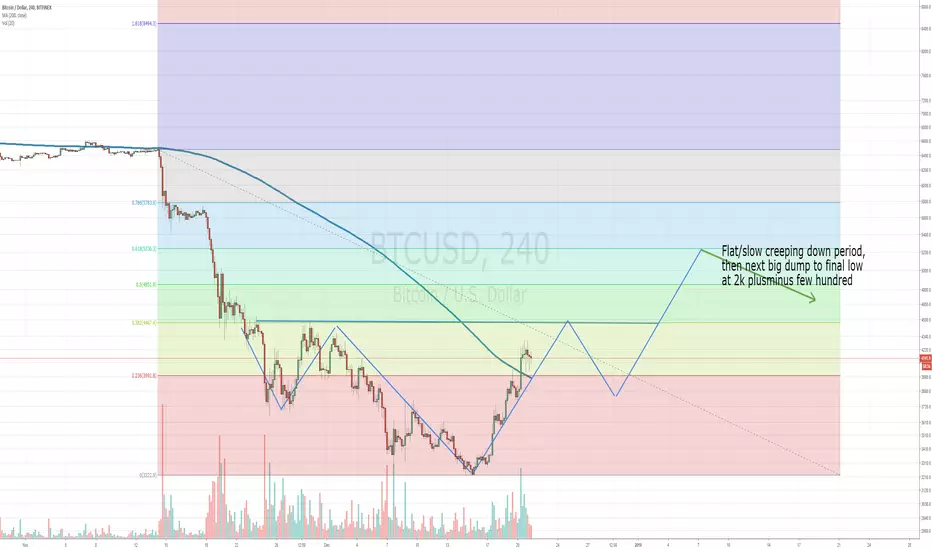
This could catapult BTC back into the 5000s, for a time at least.
Then we'll see some sideways creeping, and a longer flat, stable period of weeks, until BTC will make the final dump, sometime in March-April,
the low still remains at 2000 plusminus a few hundred imho.
I could of course be wrong, but that is the general feeling I have.
Weekly timeframe also points to this as well.
Good luck !
Nota
Stron breakout of the wedge that was forming the last days.This could go straight through the 0.382 fib resistance at 4460 USD.
If it does, we could see a brutal and fast pump straight into the 5000 range.
The maximum of this whole move could go as high as 5800.
A really nice christmas rally indeed after these brutal weeks :)
Here my current view:
Nota
Well that pump was weaker than expected. Probability for blue line, the inverted H&S structure, dramatically increased again.Plus bearish divergence in RSI and MACD in the 4h chart:
I expect a fake rally to 4480 on bitfinex, the 0.382 fib resistance, then dump to 3700-3800 finex price, to complete the inverted H&S structure.
Nota
It is beginning. Structure will Sion ne completed. Target at least 4800.Nota
Soon be completed. Damn autocorrection on Smartphone XDNota
Well, time is running out for the inverted H&S pattern. BTC looking really weak. What a start into 2019 :/Nota
Well if BTC won't bounce at least into the low 5000s, we will see some very ugly lows in 2019, even into 2020, with a long lasting, insane bearmarket. So let's hope that BTC finally gets a kick in the ass, and starts moving upwards. I am amazed how weak BTC actually is.Nota
So, it's time to update this chart again. The first inverted H&S failed, now some kind of cup and handle or larger inverted H&S can be interpreted into the 1d chart. However, the fact that BTC is taking so long for this and is doin weird stuff, makes me think that we'll see a drop instead. Also the long/short ration on finex is becoming strongly inclined towards longs. Often a sign for dumps.Declinazione di responsabilità
Le informazioni ed i contenuti pubblicati non costituiscono in alcun modo una sollecitazione ad investire o ad operare nei mercati finanziari. Non sono inoltre fornite o supportate da TradingView. Maggiori dettagli nelle Condizioni d'uso.
Declinazione di responsabilità
Le informazioni ed i contenuti pubblicati non costituiscono in alcun modo una sollecitazione ad investire o ad operare nei mercati finanziari. Non sono inoltre fornite o supportate da TradingView. Maggiori dettagli nelle Condizioni d'uso.
