Bitcoin: The Cycle Is Approaching Its Breakout Phase – “Time Is Tightening, the Band Is Compressing”
LETS START =)
This chart ultimately tells one story:
Bitcoin has never abandoned its 4-year rhythm; it simply reduces volatility each cycle while grinding toward the upper logarithmic band.
Let’s decode the structure step by step.
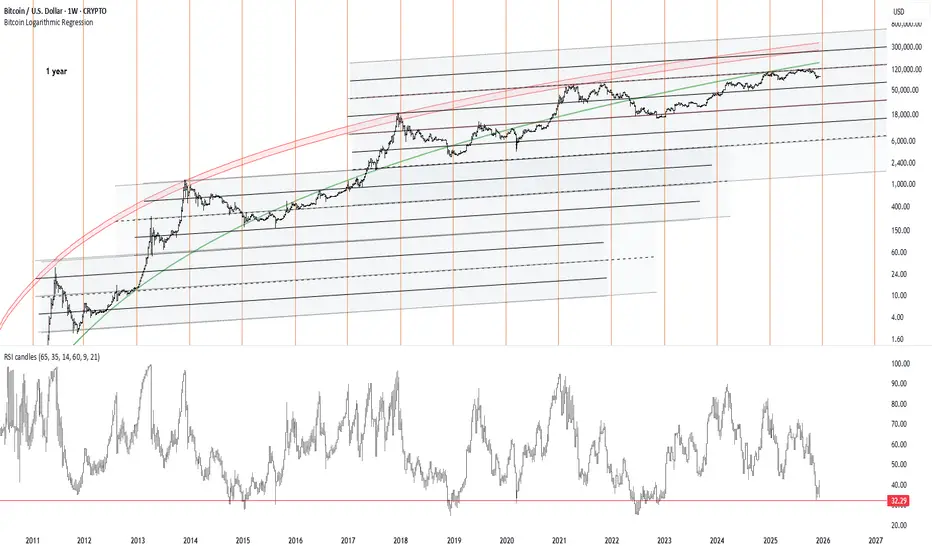
1) Logarithmic Regression Bands: “Not a trendline, a structural corridor”
The grey–black bands represent a logarithmic channel that Bitcoin has never broken below since 2011.
There are three key layers:
A) Lower-Mid Band (Cycle Floor Support)
→ The bottoms of 2012, 2015, and 2019 all touched this region.
→ Today this zone sits around ~43k–55k.
The fact that the 2022 bottom formed here already confirms that the structural low of this cycle is behind us.
B) Upper-Mid Band (Pre-Top Compression Zone)
→ In every major cycle—2013, 2017, 2021—price consolidated beneath this band right before the final blow-off phase.
→ In 2025, BTC is again compressing inside the same zone.
This implies:
Bitcoin always “stalls” once before the true cycle top.
This stall is happening now.
C) Upper Red Band (Macro Top Territory)
→ All mega tops in 2013, 2017, and 2021 hit this exact red logarithmic curve.
→ The projection for the 2025–2026 cycle peaks lands here again:
185k – 260k.
The red curve marks the end of the road.
2) Cyclical Time Markers (Orange Vertical Lines): “The 1-Year rhythm repeats”
The orange verticals represent Bitcoin’s 1-year hybrid time geometry.
Every yearly block follows the same pattern:
Momentum compresses
Volatility dries up
RSI drifts toward the floor
Final trend expansion happens in the last 3–4 months
Right now, as we enter late 2025:
The time marker again aligns with a cyclical weakness window
Which historically precedes major upside expansions
This mirrors 2012, 2015, 2019, and 2023 perfectly.
The chart is saying:
“Your time window is closing. This is the reset before expansion.”
3) RSI at 32: “Cycle-bottom signal”
The horizontal red line tracks historical cycle-bottom RSI values.
An RSI in the 32–35 range marked:
2011 bottom
2015 bottom
2019 bottom
2023 bottom
In late 2025, RSI is back in the same zone.
This tells us:
The trend is not breaking; momentum is resetting.
This is the last cooldown before the expansion leg.
Bitcoin has never topped a macro cycle with weekly RSI this low.
Every blow-off top occurred with RSI between 70–90.
RSI is saying clearly:
“The cycle top is not in. This bull market is not finished.”
4) Price Behavior: “Compression beneath upper band = calm before ignition”
Bitcoin is currently:
Squeezed between the upper-mid grey band
And the upper red logarithmic curve
Forming the tightest consolidation since 2021
This structure resembles:
→ Mid-2016 (right before the 2017 parabolic run)
→ Summer 2020 (right before the 2021 surge)
Once again, BTC is behaving like a coiled spring—fully compressed, waiting for release.
5) Cyclical Projection (Cryptollica style):
Assuming historical structure repeats:
Short Term (1–3 months):
RSI bottom → sideways grind → momentum reversal
Medium Term (3–9 months):
Break above upper-mid band
→ explosive flow into 85k–110k range
→ sentiment flips fully bullish
Macro Top Window (first half of 2026):
Touch of the upper red band
→ 185k–260k macro top potential
This band has never failed across 3 full cycles.
----------------------------------------------------------------
This chart is not showing weakness.
It is showing a textbook cyclical reset.
**“The 2026 blow-off top hasn’t even started.
This is the final compression…
the final breath…
------------------------------
2013-2018

2021-2026

LETS START =)
This chart ultimately tells one story:
Bitcoin has never abandoned its 4-year rhythm; it simply reduces volatility each cycle while grinding toward the upper logarithmic band.
Let’s decode the structure step by step.
1) Logarithmic Regression Bands: “Not a trendline, a structural corridor”
The grey–black bands represent a logarithmic channel that Bitcoin has never broken below since 2011.
There are three key layers:
A) Lower-Mid Band (Cycle Floor Support)
→ The bottoms of 2012, 2015, and 2019 all touched this region.
→ Today this zone sits around ~43k–55k.
The fact that the 2022 bottom formed here already confirms that the structural low of this cycle is behind us.
B) Upper-Mid Band (Pre-Top Compression Zone)
→ In every major cycle—2013, 2017, 2021—price consolidated beneath this band right before the final blow-off phase.
→ In 2025, BTC is again compressing inside the same zone.
This implies:
Bitcoin always “stalls” once before the true cycle top.
This stall is happening now.
C) Upper Red Band (Macro Top Territory)
→ All mega tops in 2013, 2017, and 2021 hit this exact red logarithmic curve.
→ The projection for the 2025–2026 cycle peaks lands here again:
185k – 260k.
The red curve marks the end of the road.
2) Cyclical Time Markers (Orange Vertical Lines): “The 1-Year rhythm repeats”
The orange verticals represent Bitcoin’s 1-year hybrid time geometry.
Every yearly block follows the same pattern:
Momentum compresses
Volatility dries up
RSI drifts toward the floor
Final trend expansion happens in the last 3–4 months
Right now, as we enter late 2025:
The time marker again aligns with a cyclical weakness window
Which historically precedes major upside expansions
This mirrors 2012, 2015, 2019, and 2023 perfectly.
The chart is saying:
“Your time window is closing. This is the reset before expansion.”
3) RSI at 32: “Cycle-bottom signal”
The horizontal red line tracks historical cycle-bottom RSI values.
An RSI in the 32–35 range marked:
2011 bottom
2015 bottom
2019 bottom
2023 bottom
In late 2025, RSI is back in the same zone.
This tells us:
The trend is not breaking; momentum is resetting.
This is the last cooldown before the expansion leg.
Bitcoin has never topped a macro cycle with weekly RSI this low.
Every blow-off top occurred with RSI between 70–90.
RSI is saying clearly:
“The cycle top is not in. This bull market is not finished.”
4) Price Behavior: “Compression beneath upper band = calm before ignition”
Bitcoin is currently:
Squeezed between the upper-mid grey band
And the upper red logarithmic curve
Forming the tightest consolidation since 2021
This structure resembles:
→ Mid-2016 (right before the 2017 parabolic run)
→ Summer 2020 (right before the 2021 surge)
Once again, BTC is behaving like a coiled spring—fully compressed, waiting for release.
5) Cyclical Projection (Cryptollica style):
Assuming historical structure repeats:
Short Term (1–3 months):
RSI bottom → sideways grind → momentum reversal
Medium Term (3–9 months):
Break above upper-mid band
→ explosive flow into 85k–110k range
→ sentiment flips fully bullish
Macro Top Window (first half of 2026):
Touch of the upper red band
→ 185k–260k macro top potential
This band has never failed across 3 full cycles.
----------------------------------------------------------------
This chart is not showing weakness.
It is showing a textbook cyclical reset.
**“The 2026 blow-off top hasn’t even started.
This is the final compression…
the final breath…
------------------------------
2013-2018
2021-2026
Declinazione di responsabilità
Le informazioni e le pubblicazioni non sono intese come, e non costituiscono, consulenza o raccomandazioni finanziarie, di investimento, di trading o di altro tipo fornite o approvate da TradingView. Per ulteriori informazioni, consultare i Termini di utilizzo.
Declinazione di responsabilità
Le informazioni e le pubblicazioni non sono intese come, e non costituiscono, consulenza o raccomandazioni finanziarie, di investimento, di trading o di altro tipo fornite o approvate da TradingView. Per ulteriori informazioni, consultare i Termini di utilizzo.