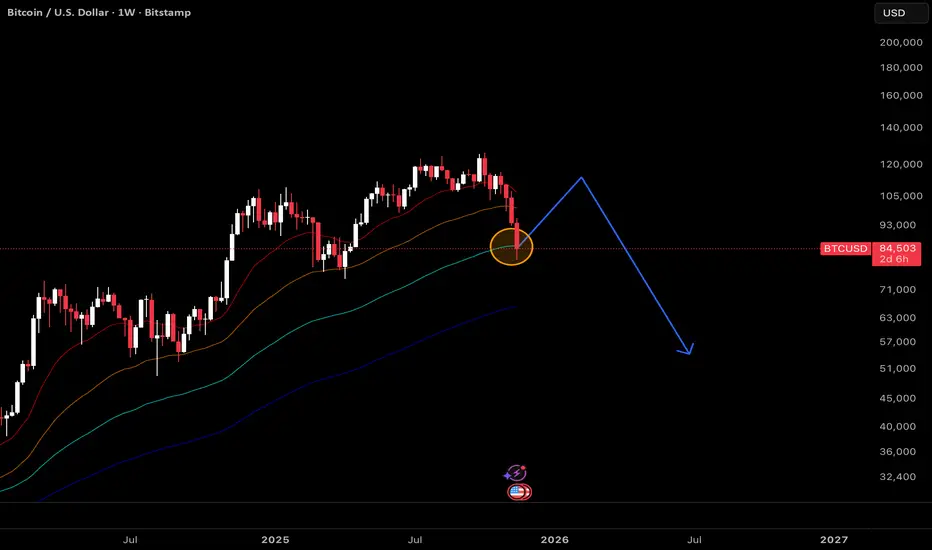
This chart analyzes the historical behavior of Bitcoin whenever price revisits the 100-week moving average (MA) during bull market phases. Historically, each tag of the 100-week MA after a strong run is followed by a relief rally—typically resulting in a lower high of about 40% off the MA touch.
However, these moves are often not the start of a new uptrend, but rather countertrend bounces that precede major bear market phases. This setup repeats across cycles: after the 100-week MA touch in a bull market, price frequently prints a significant lower high before breaking down further as broader bearish conditions take hold.
However, these moves are often not the start of a new uptrend, but rather countertrend bounces that precede major bear market phases. This setup repeats across cycles: after the 100-week MA touch in a bull market, price frequently prints a significant lower high before breaking down further as broader bearish conditions take hold.
Declinazione di responsabilità
Le informazioni e le pubblicazioni non sono intese come, e non costituiscono, consulenza o raccomandazioni finanziarie, di investimento, di trading o di altro tipo fornite o approvate da TradingView. Per ulteriori informazioni, consultare i Termini di utilizzo.
Declinazione di responsabilità
Le informazioni e le pubblicazioni non sono intese come, e non costituiscono, consulenza o raccomandazioni finanziarie, di investimento, di trading o di altro tipo fornite o approvate da TradingView. Per ulteriori informazioni, consultare i Termini di utilizzo.