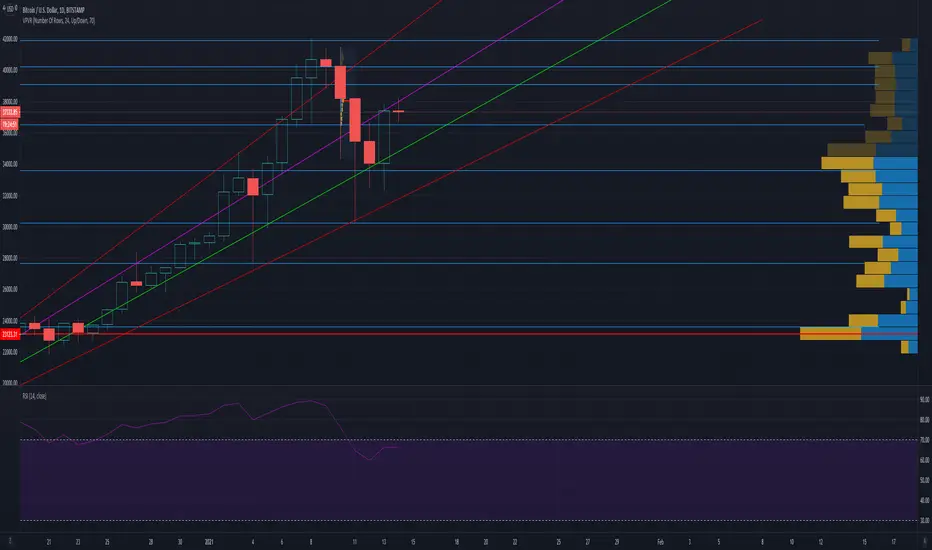
As you can see there are various lines on the graph but I will highlight what they all mean.
Top Red: Over bought Bubble
In between the Bottom Red Line and Pink Line it is a healthy run up to 100k+
If it trades below the bottom Red or close to it, is a strong buy
If it trades along the green we are good to go.
I have mapped out in horizontal blue lines the major support and resistance at each price level
Don't criticize me too much as I am only 3 and 1/2 months into TA but always love feedback ;)
Declinazione di responsabilità
Le informazioni ed i contenuti pubblicati non costituiscono in alcun modo una sollecitazione ad investire o ad operare nei mercati finanziari. Non sono inoltre fornite o supportate da TradingView. Maggiori dettagli nelle Condizioni d'uso.
Declinazione di responsabilità
Le informazioni ed i contenuti pubblicati non costituiscono in alcun modo una sollecitazione ad investire o ad operare nei mercati finanziari. Non sono inoltre fornite o supportate da TradingView. Maggiori dettagli nelle Condizioni d'uso.