🚨 Bitcoin (BTC/USD) Technical Analysis – 1H Chart 🚨
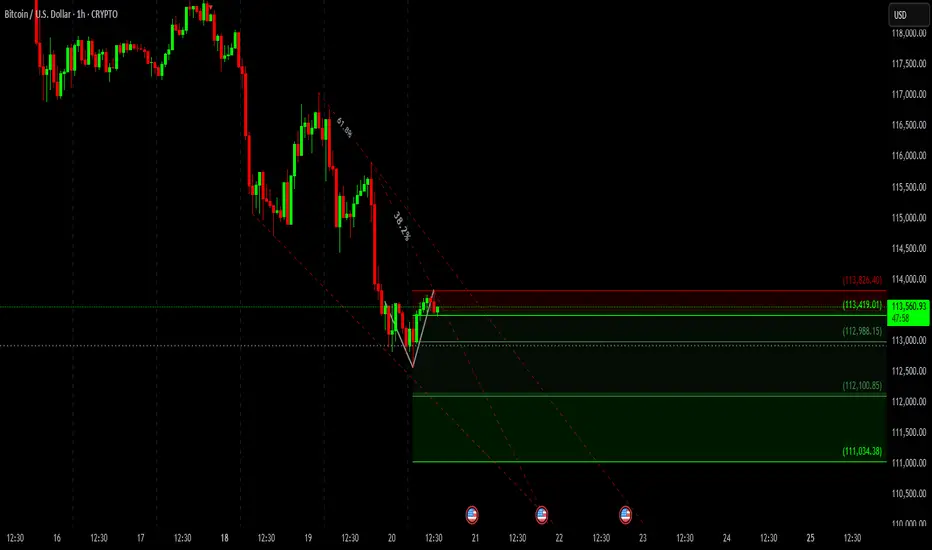
Bitcoin is currently trading around $113,440, showing signs of rejection near the 38.2% Fibonacci retracement after a recent bounce from the channel’s lower boundary.
📉 Trend Outlook:
The pair remains inside a descending channel, indicating the bearish momentum is still dominant.
Price attempted to recover but got rejected below the 61.8% retracement zone, showing strong selling pressure.
📌 Key Levels to Watch:
Resistance: $113,826 (major supply zone)
Immediate Support: $113,419 (short-term structure)
Target Supports:
$112,988
$112,100
$111,034
⚡ Trading View:
As long as BTC stays under $113,800 resistance, the downside targets remain open. Breaking below $113,419 could accelerate selling pressure towards $112k levels. Bulls need a decisive break above $113,800 to reverse momentum.
✅ Summary:
Trend → Bearish (within a falling channel)
Bias → Sell rallies below $113,800
Potential Targets → $112,988 – $111,034
#Bitcoin #BTC #CryptoTrading #CryptoAnalysis #BTCUSD #CryptoCharts #Fibonacci #PriceAction #CryptoBearish #BTCAnalysis
Declinazione di responsabilità
Le informazioni ed i contenuti pubblicati non costituiscono in alcun modo una sollecitazione ad investire o ad operare nei mercati finanziari. Non sono inoltre fornite o supportate da TradingView. Maggiori dettagli nelle Condizioni d'uso.
Declinazione di responsabilità
Le informazioni ed i contenuti pubblicati non costituiscono in alcun modo una sollecitazione ad investire o ad operare nei mercati finanziari. Non sono inoltre fornite o supportate da TradingView. Maggiori dettagli nelle Condizioni d'uso.