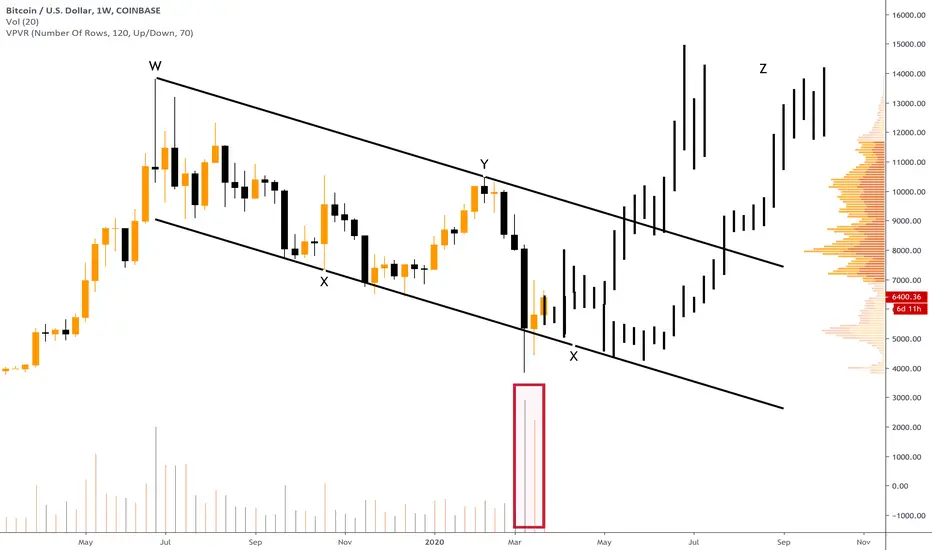
Previous two weeks were VERY volatile, volumes were huge, but that's not a secret for anyone. Both weeks closed inside the bullish flag. So, we have two options:
BTC trades in the range between $6300 and $6000, then heading towards the upped border of the channel for some time - then broke one, which leads to the "Z" point.
BTC trades in the range between $6300 and $6000, but then goes lower in order to re-test the support of the channel once again - then goes upwards and break through the resistance.
Klondike Official Links:
Website:
klondikepro.com/
Public Telegram Channel:
t.me/CryptoKlondike
Twitter:
twitter.com/Robert_Klondike
Trade on Bybit with us:
partner.bybit.com/b/6694
Website:
klondikepro.com/
Public Telegram Channel:
t.me/CryptoKlondike
Twitter:
twitter.com/Robert_Klondike
Trade on Bybit with us:
partner.bybit.com/b/6694
Pubblicazioni correlate
Declinazione di responsabilità
Le informazioni ed i contenuti pubblicati non costituiscono in alcun modo una sollecitazione ad investire o ad operare nei mercati finanziari. Non sono inoltre fornite o supportate da TradingView. Maggiori dettagli nelle Condizioni d'uso.
