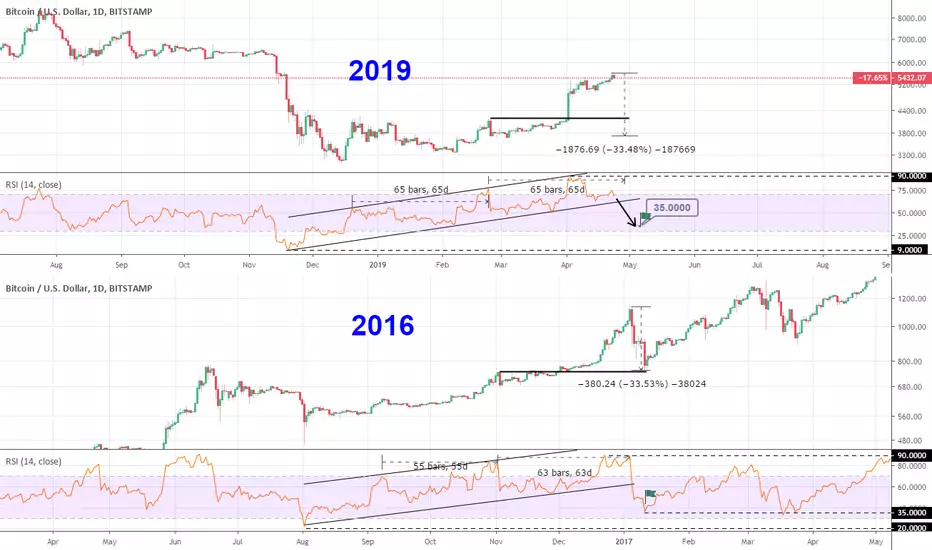
Since last November, Bitcoin's RSI bottomed near 9.000 and has been making Higher Highs and Higher Lows since, developing a Channel Up. The peak of this Channel is so far near 90.000, which was achieved on the aggressive rise earlier in April.
A similar RSI pattern was printed in 2016. The bottom was made near 20.000 this time, with Higher Highs and Higher Lows following. Those led to a peak near 90.000 as well. After this High a strong pull back took place that broke the Channel downwards making an RSI low near 35.000.
We are pointing this pattern out as something that traders using the RSI should keep in mind when formulating their trading levels in the coming days. We are waiting for the RSI to approach 35.000 before buying again. This however shouldn't discourage investors with a long term mindset from buying even on the current levels, as Bitcoin is still at the very early stages of the new bull cycle.
See the reasons by clicking on the studies below:


** If you like our free content follow our profile (tradingview.com/u/InvestingScope) to get more daily ideas. **
Comments and likes are greatly appreciated.
A similar RSI pattern was printed in 2016. The bottom was made near 20.000 this time, with Higher Highs and Higher Lows following. Those led to a peak near 90.000 as well. After this High a strong pull back took place that broke the Channel downwards making an RSI low near 35.000.
We are pointing this pattern out as something that traders using the RSI should keep in mind when formulating their trading levels in the coming days. We are waiting for the RSI to approach 35.000 before buying again. This however shouldn't discourage investors with a long term mindset from buying even on the current levels, as Bitcoin is still at the very early stages of the new bull cycle.
See the reasons by clicking on the studies below:
** If you like our free content follow our profile (tradingview.com/u/InvestingScope) to get more daily ideas. **
Comments and likes are greatly appreciated.
Telegram: t.me/investingscope
investingscope.com
Over 65% accuracy on Private Signals Channel.
Over 15% return monthly on our Account Management Plan.
Account RECOVERY services.
Free Channel: t.me/investingscopeofficial
investingscope.com
Over 65% accuracy on Private Signals Channel.
Over 15% return monthly on our Account Management Plan.
Account RECOVERY services.
Free Channel: t.me/investingscopeofficial
Pubblicazioni correlate
Declinazione di responsabilità
Le informazioni e le pubblicazioni non sono intese come, e non costituiscono, consulenza o raccomandazioni finanziarie, di investimento, di trading o di altro tipo fornite o approvate da TradingView. Per ulteriori informazioni, consultare i Termini di utilizzo.