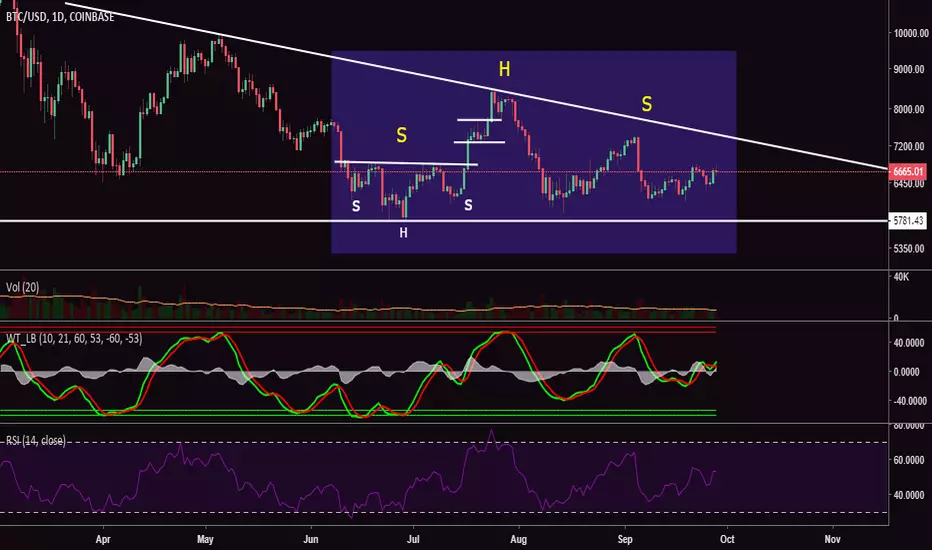
Bitcoin (BTC) is printing a pattern which is a very rare sight in the world of technical analysis. This formation seen on the above daily chart for BTC/USD is called a compound fulcrum. It comprises of an inverse head and shoulders and a head and shoulders trading inside a wedge in the order visible above. This is a very bullish sign which often results in the price breaking straight through the wedge and eventually reaching a new high. We have seen similar patterns in the past for commodities like Copper as well as a few stocks. Bitcoin (BTC) is also currently classified as a commodity which is why it will be interesting to see how Bitcoin (BTC)’s recent compound fulcrum compares to that of Copper and a popular stock, CPST.
Read Detailed Analysis: cryptodaily.co.uk/2018/09/bitcoin-btc-compound-fulcrum-and-correlation-with-copper/
Read Detailed Analysis: cryptodaily.co.uk/2018/09/bitcoin-btc-compound-fulcrum-and-correlation-with-copper/
Declinazione di responsabilità
Le informazioni ed i contenuti pubblicati non costituiscono in alcun modo una sollecitazione ad investire o ad operare nei mercati finanziari. Non sono inoltre fornite o supportate da TradingView. Maggiori dettagli nelle Condizioni d'uso.
Declinazione di responsabilità
Le informazioni ed i contenuti pubblicati non costituiscono in alcun modo una sollecitazione ad investire o ad operare nei mercati finanziari. Non sono inoltre fornite o supportate da TradingView. Maggiori dettagli nelle Condizioni d'uso.