I removed all indicators and trend lines to look at the price action only
Just to note a pattern in btc
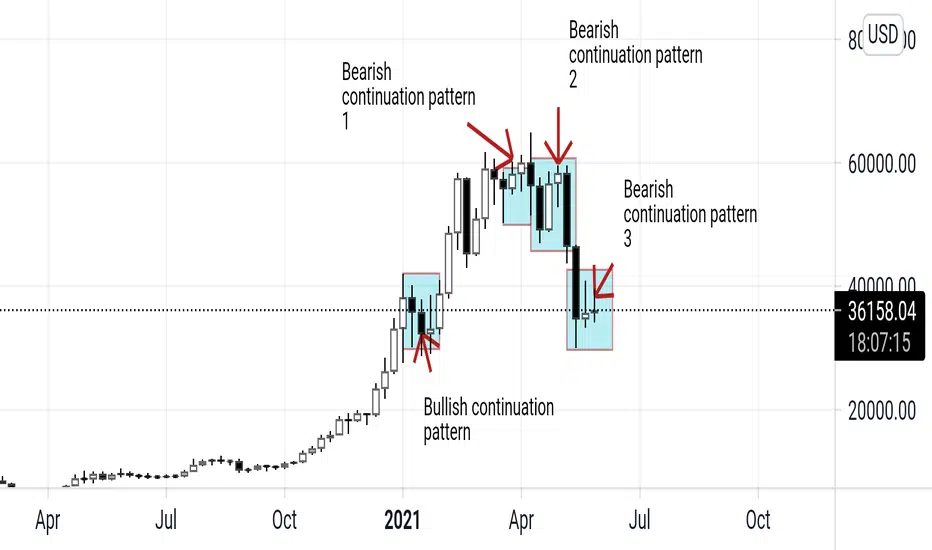
We see a few continuation patterns in btc on the weekly time frame.
We see one bullish and a few bearish one
At the top or tower top formation that is also a bearish signal
The pattern sometimes come in three before a buy can happen a long term buy.
We are currently seeing the third one forming
If this is correct than we will see 12 000
Reason being after confirmation of pattern you always see one more bearish or bullish candle down or up according to time line this pattern is formed on
In this case its the weekly so if next week we see more bear down swing than we will see one more week of bearishness until 20 june
THIS WOULD ALSO CONFIRM THE HEAD AND SHOULDERS PATTERN ON THE DAILY AND WEEKLY
SCARY I HOPE I'M WRONG HERE
BUT LET'S SEE
SO FOR ALL MY ANALYSIS HAS BEEN ON PAR
Just to note a pattern in btc
We see a few continuation patterns in btc on the weekly time frame.
We see one bullish and a few bearish one
At the top or tower top formation that is also a bearish signal
The pattern sometimes come in three before a buy can happen a long term buy.
We are currently seeing the third one forming
If this is correct than we will see 12 000
Reason being after confirmation of pattern you always see one more bearish or bullish candle down or up according to time line this pattern is formed on
In this case its the weekly so if next week we see more bear down swing than we will see one more week of bearishness until 20 june
THIS WOULD ALSO CONFIRM THE HEAD AND SHOULDERS PATTERN ON THE DAILY AND WEEKLY
SCARY I HOPE I'M WRONG HERE
BUT LET'S SEE
SO FOR ALL MY ANALYSIS HAS BEEN ON PAR
Declinazione di responsabilità
Le informazioni ed i contenuti pubblicati non costituiscono in alcun modo una sollecitazione ad investire o ad operare nei mercati finanziari. Non sono inoltre fornite o supportate da TradingView. Maggiori dettagli nelle Condizioni d'uso.
Declinazione di responsabilità
Le informazioni ed i contenuti pubblicati non costituiscono in alcun modo una sollecitazione ad investire o ad operare nei mercati finanziari. Non sono inoltre fornite o supportate da TradingView. Maggiori dettagli nelle Condizioni d'uso.