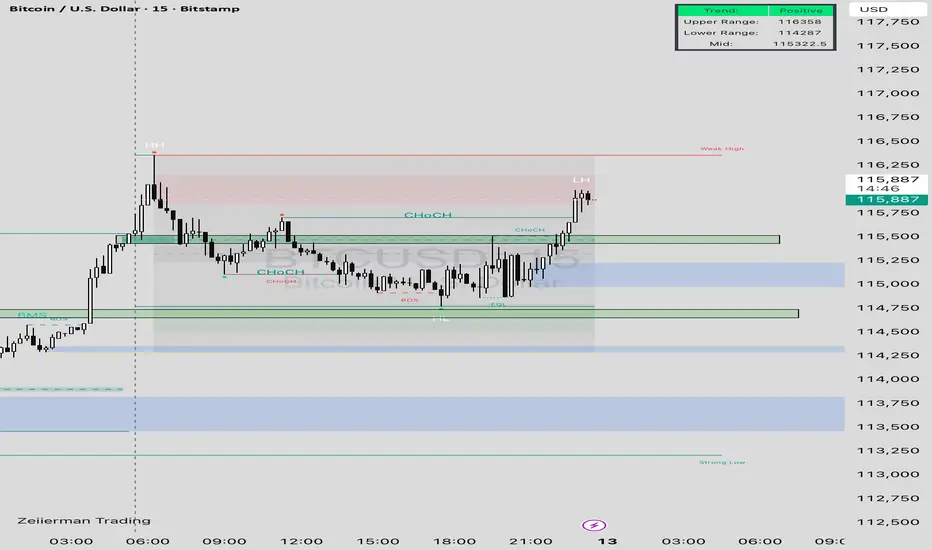
This 15-minute Bitcoin chart highlights a positive market trend with current price action at $115,896 (+0.31%). The structure shows a recent Change of Character (ChoCH) and Break of Structure (BOS), indicating bullish momentum after reclaiming support near 114,750. The price is testing the 116,000 resistance zone, marked by a weak high (HH) and lower high (LH) structure. Key levels are defined with:
• Upper Range: 116,358
• Lower Range: 114,287
• Midpoint: 115,322.5
The chart suggests possible liquidity grabs near the weak high and continuation toward the upper range if bullish momentum holds, while failure could retest demand zones around 115,000–114,750.
 BTCUSD
• Upper Range: 116,358
• Lower Range: 114,287
• Midpoint: 115,322.5
The chart suggests possible liquidity grabs near the weak high and continuation toward the upper range if bullish momentum holds, while failure could retest demand zones around 115,000–114,750.
Declinazione di responsabilità
Le informazioni ed i contenuti pubblicati non costituiscono in alcun modo una sollecitazione ad investire o ad operare nei mercati finanziari. Non sono inoltre fornite o supportate da TradingView. Maggiori dettagli nelle Condizioni d'uso.
Declinazione di responsabilità
Le informazioni ed i contenuti pubblicati non costituiscono in alcun modo una sollecitazione ad investire o ad operare nei mercati finanziari. Non sono inoltre fornite o supportate da TradingView. Maggiori dettagli nelle Condizioni d'uso.