📊 BTC 1W Cycle Map — 1064-Day Cadence Intact
🎯 Top window: Week of 06 Oct ’25 (± 1–2 weeks)
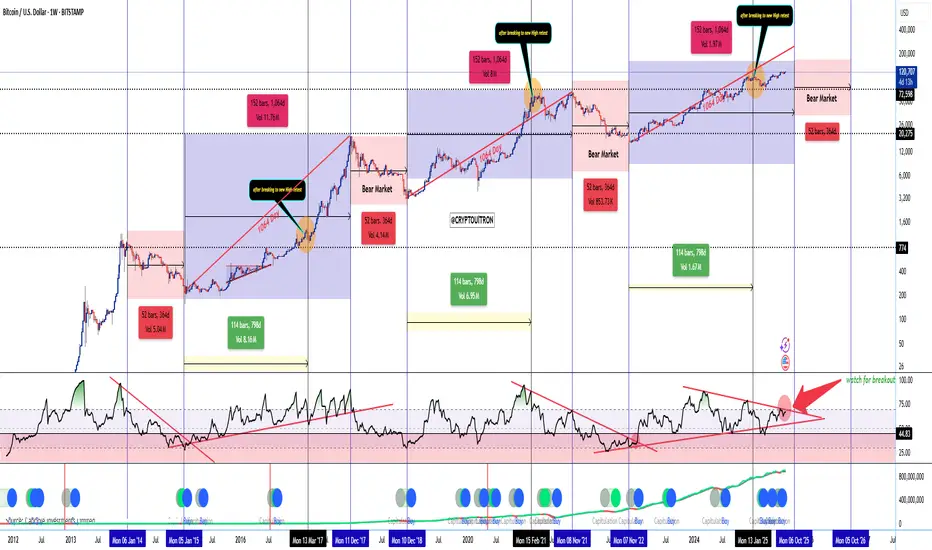
🧩 Cycle structure (from chart):
📈 RSI setup:
🔍 Key chart signals:
📌 My read:
⏳ Post-top expectations:
~1 year of decline/mean reversion → likely retrace to prior breakout demand (mid-70s to low-80s).
Chart from 2023

🎯 Top window: Week of 06 Oct ’25 (± 1–2 weeks)
🧩 Cycle structure (from chart):
- 1064-day rhythm to macro top has played out in 2013, 2017, and 2021.
- From the Nov ’22 cycle low, the next 1064d lands on Oct ’25 → that’s my projected cycle top zone.
- Each cycle shows ATH break → retest → terminal leg before topping. Orange circles = retests. We’ve completed ours.
- Bear markets have been rhythmic: ~52 weeks / 364 bars of decline post-top. Marked in red for all past cycles.
📈 RSI setup:
- 1W RSI downtrend break has always preceded the final blow-off leg.
- Currently coiling just under that trendline (big red arrow). A confirmed breakout is my ignition trigger.
🔍 Key chart signals:
- Blue/green capitulation buy dots (hash ribbon + cycle models) historically cluster before major legs up, not at tops.
- Volume cycles also show ~114 weeks (798 days) of expansion phases between retest and top.
📌 My read:
- If RSI fails and price closes <95–100k weekly, I’ll treat it as an early-top scenario.
⏳ Post-top expectations:
~1 year of decline/mean reversion → likely retrace to prior breakout demand (mid-70s to low-80s).
Chart from 2023
Trade attivo

Trade chiuso: obiettivo raggiunto

Nota
📊 BTC Update — Post-Monthly Close (Oct 1)🔄 Since the Sept 20 update
• We said to expect chop/liquidity hunts between $113.3K–$116K with walls at $117.7K–$118.2K.
• We wicked down to $108.6K on Sept 22 (downside pools at 109/108 filled), then reclaimed back above $113.3K.
• September monthly closed ~$114K → macro breakout structure intact.
⸻
🧭 Where we are now (multi-TF read)
• Monthly: Green close at $114K; structure above 20MA band and prior ATH consolidation = healthy.
• Weekly: Price pressing the mid-band/EMA cluster. RSI mid-50s (no blow-off), MACD flat → consolidation, not breakdown.
• 3D / 1D: After the $108.6K sweep, EMAs curled up; daily RSI back ~50+ and attempting a momentum flip.
• 4H / 1H: Clear impulsive reclaim from the lows; 4H RSI > 50 and the down-trendline break is holding → room to probe $115.8K → $116.6K.
⸻
🗓 What to watch next
• This week (Sun close):
• ✅ Close > $115.5K → momentum recovery → targets $116.6K → $118.2K.
• 🟡 Inside $113.3K–$115.5K → continued chop / stop-hunts.
• ❌ Close < $113.3K → opens $111.5K, with risk of $109K retest.
• October path (base case):
• Bias = bullish consolidation while > $113.3K.
• Expect liquidity games between $115.8K–$118.2K before any clean break.
• Weekly close > $119.5K = breakout confirmation → $124.5K, then $132K+.
• Daily close < $113.3K = caution → $111K → $108.5K sweep risk.
⸻
🎯 Trade framing (scalp & spot)
• Scalp long idea: pullbacks into $113.5K–$114.0K with invalid < $113.3K, targets $115.8K / $116.6K, runner for $118.2K.
• Spot / swing: add only on weekly reclaim > $119.5K; invalidation weekly < $111K.
Nota
🔑 Key Levels you can play with 👇👇👇Supports
• $114.3K–$114.5K → intraday reclaim pivot (now).
• $113.3K–$113.5K → 🔑 defense (Fib/heatmap shelf).
• $112.0K–$112.3K → daily mid-band/EMA support.
• $111.3K–$111.5K → next liquidity shelf.
• $108.5K–$109.0K → swept zone; loses this = $107K test.
• $107.0K–$107.5K → macro swing low / invalidation of the current leg.
• $104–$105K → ABC extension target if $107K fails.
Resistances
• $115.8K–$116.1K → first magnet (heatmap + EMAs).
• $116.6K–$116.8K → wall #2.
• $117.7K–$118.2K → main rejection cluster (0.702 + liquidity).
• $119.5K–$120.0K → weekly breakout trigger.
• $123.7K–$124.5K → macro range high; above here = path toward Fib 1.618+.
Nota
🧠 Cycle + Macro Context• We’re at ~Day 1050 from the Nov ’22 bottom. In 2017 & 2021 the cycle tops printed ~Day 1064.
• Conclusion: the time window for a macro top is OPEN, but structure says “not yet”:
• 2W RSI is compressing in a triangle <75 (prior tops were RSI > 90).
• No Pi Cycle Top and 1.618–1.702 Fib (173K–196K) still untagged.
• Rate-cut context (chart marks):
• Sept 18, 2024 FOMC pause/hint preceded BTC’s big reclaim.
• Sept 17, 2025 first cut (per chart annotation) = liquidity tailwind. BTC often front-runs → supports a final leg before the true cycle peak.
✅ Final Read
• Time says the top window is open (1050 → 1064 days),
• Structure says final leg not printed (RSI not blown off; key Fibs unhit).
• As long as $113.3K holds, treat October as final consolidation before the run at $118K → $120K → $124.5K.
• Lose $113.3K and especially $111K → expect another $109K / $108.5K liquidity sweep.
Declinazione di responsabilità
Le informazioni ed i contenuti pubblicati non costituiscono in alcun modo una sollecitazione ad investire o ad operare nei mercati finanziari. Non sono inoltre fornite o supportate da TradingView. Maggiori dettagli nelle Condizioni d'uso.
Declinazione di responsabilità
Le informazioni ed i contenuti pubblicati non costituiscono in alcun modo una sollecitazione ad investire o ad operare nei mercati finanziari. Non sono inoltre fornite o supportate da TradingView. Maggiori dettagli nelle Condizioni d'uso.