The recent market shakeout has culminated not in a prolonged bearish descent, but in the genesis of a violent, V-shaped recovery that is poised to catch the majority of traders offside. While many were bracing for a deeper correction toward $70,000 or lower, Bitcoin demonstrated its characteristic resilience, executing a breathtaking +10% surge from the $80,000–$82,000 local bottom in under 72 hours, decisively reclaiming the $88,000 level. This is not a fleeting, feeble rebound—a classic "dead cat bounce"—but rather a textbook capitulation reversal, signaling that the market has flushed out its weakest hands and is now primed for a significant upward trajectory.
The confluence of on-chain, technical, and macroeconomic data points creates an overwhelmingly bullish mosaic. Let's dissect the critical factors underpinning this thesis:
1. A Market Flushed Clean: The Great Liquidation Engine
The recent downturn served a vital purpose: it purged the system of excessive leverage. The liquidation of a staggering $1.68 billion in long positions last week was a painful but necessary reset. This has created a profoundly asymmetrical setup: the short side of the market is now massively over-extended. As price begins its ascent, these short positions are being forcibly closed, creating a powerful feedback loop known as a short squeeze. This adds immense fuel to the rally, as bears are compelled to buy back Bitcoin to cover their losing bets, accelerating upward momentum.
2. Peak Fear: A Contrarian's Dream
Market sentiment is a powerful contrary indicator. The Fear & Greed Index plummeting to a reading of 10–12—its lowest level since the panic of the March 2020 COVID crash—is not a signal to sell, but a historic signal to buy. Such extreme fear has consistently marked generational buying opportunities. It is in these depths of pessimism that "monster rallies" find their footing, as the last sellers capitulate and only committed buyers remain.
3. The "Smart Money" Divergence: Real Buying Emerges
While futures markets were in turmoil, a critical development was unfolding in the spot market. The Spot Cumulative Volume Delta (CVD) on major exchanges like Binance and Coinbase has flipped aggressively green. This technical indicator reveals that the net volume of actual Bitcoin purchases is overwhelmingly outpacing sell volume. This signifies that real buyers are stepping in to acquire the underlying asset, moving beyond the leveraged speculation of the futures markets. This is the foundation of a sustainable rally.
4. A Historically Reliable Signal: The Post-Halving Oversold Bounce
The data here is unequivocal. Every single instance in Bitcoin's post-halving history where the weekly Relative Strength Index (RSI) has dipped into deeply oversold territory (specifically below 35) has been followed by an explosive move to the upside. Historical analysis shows that the subsequent 3–6 month period has averaged staggering gains of over +180%. We are currently exiting this exact oversold condition, setting the stage for a statistically probable, powerful advance.
5. The Macroeconomic Tailwind: Liquidity on the Horizon
The global macroeconomic landscape is shifting in favor of risk assets like Bitcoin.
Geopolitical Easing: Former President Trump's recent tweet regarding inviting President Xi to Mar-a-Lago to cool trade tensions is a potential catalyst for a "risk-on" environment, reducing perceived global systemic risks.
Monetary Policy Pivot: Perhaps even more critical is the Federal Reserve's impending shift. Fed futures are now aggressively pricing in five or more interest rate cuts for 2026. This预示着 the reopening of the liquidity floodgates, and as history has shown, abundant liquidity is the rocket fuel for digital asset valuations.
6. Institutional Conviction: Buying When There's "Blood in the Streets"
The most telling sign of institutional strategy was revealed last week. While retail investors were panic-selling, the world's largest asset manager, BlackRock, saw its IBIT Bitcoin ETF attract a monumental $1.4 billion in inflows as the price was crashing. This is the very definition of "smart money" buying the exact bottom. They are not timing the market on a daily basis; they are allocating capital at scale when value presents itself. This sentiment is echoed by other prestigious institutions, with Harvard University reportedly tripling its Bitcoin ETF allocation to $443 million, signaling deep conviction among sophisticated endowments.
7. Miner Health: Selling Pressure Subsides
The "miner capitulation" that had been a source of persistent selling pressure has likely reached its peak. Data indicates this phase crested two weeks ago, with the network hash rate already beginning to recover. This means a significant source of operational selling from miners needing to cover costs is drying up, removing a major overhang from the market and allowing price appreciation to occur with less resistance.
The Technical Picture: A Symphony of Bullish Signals
The charts are aligning to form a profoundly bullish technical structure:
The "Death Cross" Trap: The recent formation of a death cross (where the 50-day moving average crosses below the 200-day moving average) on the daily chart has historically been a bearish omen. However, the key detail is that price has held perfectly above the critical support level despite this signal. This identical setup in 3Q 2023 preceded a historic +192% rally.
Bullish Divergence in the Making: The weekly RSI is on the cusp of forming a clear bullish divergence—where price makes a lower low, but the RSI makes a higher low. This is a classic technical indicator that selling momentum is exhausting and a reversal is imminent.
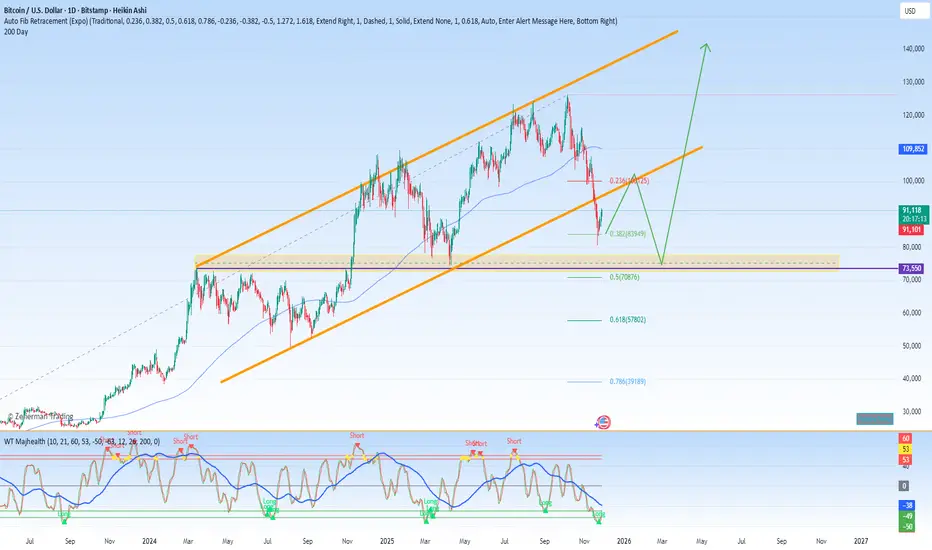
The Critical Resistance Flip: The immediate technical hurdle is the $90,000–$92,000 resistance zone. A decisive break and flip of this level into support is the next key milestone. Once this technical ceiling is conquered, the path toward a $100,000 retest becomes highly probable, likely before the end of the year.
Projected Price Trajectory: A Roadmap to New All-Time Highs
Based on this confluence of factors, a logical and aggressive price target framework emerges:
Short-Term (This Week): A test and breach of the $95,000–$98,000 range.
Year-End (Mid-December): A sustained move into the $108,000–$112,000 territory.
Q1 2026 Kick-Off (January): The assault on and establishment of a new all-time high, targeting the $135,000–$150,000 range.
Parabolic Peak (Q1 2026): The culmination of this cycle leg, with $200,000+ remaining the base case as mainstream FOMO reaches a fever pitch.
Conclusion: The Moment of Maximum Opportunity
This is unequivocally not a dead cat bounce. This is the precise inflection point where weak-handed speculators are separated from long-term believers—the moment where the foundational groundwork is laid for the next leg of Bitcoin's parabolic advance. The data, from on-chain metrics to institutional flows and macro tailwinds, all point in one direction: unequivocally higher.
For those with the conviction to see through the short-term noise, the strategy is clear: accumulate positions, secure your holdings, and consider stepping away from the day-to-day chart volatility. The stage is set for a monumental move, and the rewards will go to those who had the foresight to load the boat when fear was at its absolute peak. The view from six figures in January will make the volatility of today a distant memory.
The confluence of on-chain, technical, and macroeconomic data points creates an overwhelmingly bullish mosaic. Let's dissect the critical factors underpinning this thesis:
1. A Market Flushed Clean: The Great Liquidation Engine
The recent downturn served a vital purpose: it purged the system of excessive leverage. The liquidation of a staggering $1.68 billion in long positions last week was a painful but necessary reset. This has created a profoundly asymmetrical setup: the short side of the market is now massively over-extended. As price begins its ascent, these short positions are being forcibly closed, creating a powerful feedback loop known as a short squeeze. This adds immense fuel to the rally, as bears are compelled to buy back Bitcoin to cover their losing bets, accelerating upward momentum.
2. Peak Fear: A Contrarian's Dream
Market sentiment is a powerful contrary indicator. The Fear & Greed Index plummeting to a reading of 10–12—its lowest level since the panic of the March 2020 COVID crash—is not a signal to sell, but a historic signal to buy. Such extreme fear has consistently marked generational buying opportunities. It is in these depths of pessimism that "monster rallies" find their footing, as the last sellers capitulate and only committed buyers remain.
3. The "Smart Money" Divergence: Real Buying Emerges
While futures markets were in turmoil, a critical development was unfolding in the spot market. The Spot Cumulative Volume Delta (CVD) on major exchanges like Binance and Coinbase has flipped aggressively green. This technical indicator reveals that the net volume of actual Bitcoin purchases is overwhelmingly outpacing sell volume. This signifies that real buyers are stepping in to acquire the underlying asset, moving beyond the leveraged speculation of the futures markets. This is the foundation of a sustainable rally.
4. A Historically Reliable Signal: The Post-Halving Oversold Bounce
The data here is unequivocal. Every single instance in Bitcoin's post-halving history where the weekly Relative Strength Index (RSI) has dipped into deeply oversold territory (specifically below 35) has been followed by an explosive move to the upside. Historical analysis shows that the subsequent 3–6 month period has averaged staggering gains of over +180%. We are currently exiting this exact oversold condition, setting the stage for a statistically probable, powerful advance.
5. The Macroeconomic Tailwind: Liquidity on the Horizon
The global macroeconomic landscape is shifting in favor of risk assets like Bitcoin.
Geopolitical Easing: Former President Trump's recent tweet regarding inviting President Xi to Mar-a-Lago to cool trade tensions is a potential catalyst for a "risk-on" environment, reducing perceived global systemic risks.
Monetary Policy Pivot: Perhaps even more critical is the Federal Reserve's impending shift. Fed futures are now aggressively pricing in five or more interest rate cuts for 2026. This预示着 the reopening of the liquidity floodgates, and as history has shown, abundant liquidity is the rocket fuel for digital asset valuations.
6. Institutional Conviction: Buying When There's "Blood in the Streets"
The most telling sign of institutional strategy was revealed last week. While retail investors were panic-selling, the world's largest asset manager, BlackRock, saw its IBIT Bitcoin ETF attract a monumental $1.4 billion in inflows as the price was crashing. This is the very definition of "smart money" buying the exact bottom. They are not timing the market on a daily basis; they are allocating capital at scale when value presents itself. This sentiment is echoed by other prestigious institutions, with Harvard University reportedly tripling its Bitcoin ETF allocation to $443 million, signaling deep conviction among sophisticated endowments.
7. Miner Health: Selling Pressure Subsides
The "miner capitulation" that had been a source of persistent selling pressure has likely reached its peak. Data indicates this phase crested two weeks ago, with the network hash rate already beginning to recover. This means a significant source of operational selling from miners needing to cover costs is drying up, removing a major overhang from the market and allowing price appreciation to occur with less resistance.
The Technical Picture: A Symphony of Bullish Signals
The charts are aligning to form a profoundly bullish technical structure:
The "Death Cross" Trap: The recent formation of a death cross (where the 50-day moving average crosses below the 200-day moving average) on the daily chart has historically been a bearish omen. However, the key detail is that price has held perfectly above the critical support level despite this signal. This identical setup in 3Q 2023 preceded a historic +192% rally.
Bullish Divergence in the Making: The weekly RSI is on the cusp of forming a clear bullish divergence—where price makes a lower low, but the RSI makes a higher low. This is a classic technical indicator that selling momentum is exhausting and a reversal is imminent.
The Critical Resistance Flip: The immediate technical hurdle is the $90,000–$92,000 resistance zone. A decisive break and flip of this level into support is the next key milestone. Once this technical ceiling is conquered, the path toward a $100,000 retest becomes highly probable, likely before the end of the year.
Projected Price Trajectory: A Roadmap to New All-Time Highs
Based on this confluence of factors, a logical and aggressive price target framework emerges:
Short-Term (This Week): A test and breach of the $95,000–$98,000 range.
Year-End (Mid-December): A sustained move into the $108,000–$112,000 territory.
Q1 2026 Kick-Off (January): The assault on and establishment of a new all-time high, targeting the $135,000–$150,000 range.
Parabolic Peak (Q1 2026): The culmination of this cycle leg, with $200,000+ remaining the base case as mainstream FOMO reaches a fever pitch.
Conclusion: The Moment of Maximum Opportunity
This is unequivocally not a dead cat bounce. This is the precise inflection point where weak-handed speculators are separated from long-term believers—the moment where the foundational groundwork is laid for the next leg of Bitcoin's parabolic advance. The data, from on-chain metrics to institutional flows and macro tailwinds, all point in one direction: unequivocally higher.
For those with the conviction to see through the short-term noise, the strategy is clear: accumulate positions, secure your holdings, and consider stepping away from the day-to-day chart volatility. The stage is set for a monumental move, and the rewards will go to those who had the foresight to load the boat when fear was at its absolute peak. The view from six figures in January will make the volatility of today a distant memory.
Declinazione di responsabilità
Le informazioni e le pubblicazioni non sono intese come, e non costituiscono, consulenza o raccomandazioni finanziarie, di investimento, di trading o di altro tipo fornite o approvate da TradingView. Per ulteriori informazioni, consultare i Termini di utilizzo.
Declinazione di responsabilità
Le informazioni e le pubblicazioni non sono intese come, e non costituiscono, consulenza o raccomandazioni finanziarie, di investimento, di trading o di altro tipo fornite o approvate da TradingView. Per ulteriori informazioni, consultare i Termini di utilizzo.