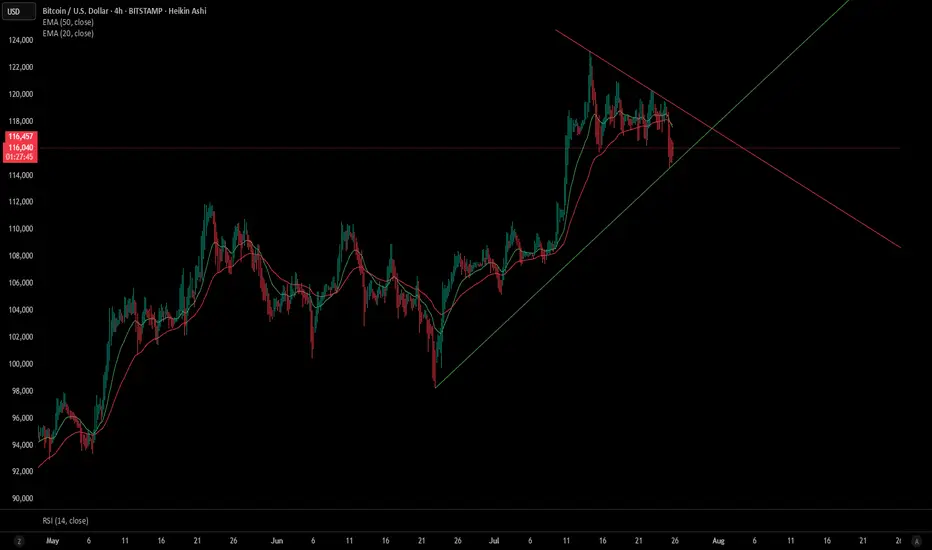
Bitcoin is currently testing critical support at the base of a rising wedge / symmetrical triangle on the 4-hour Heikin Ashi chart. The market recently rejected a descending resistance trendline, and price is now threatening to break the ascending support.
EMAs: Trading below both the 20 EMA ($117,554) and 50 EMA ($117,762), signaling near-term bearish momentum.
RSI (14): At 45.38, pointing to weakening bullish pressure, approaching neutral-bearish territory.
Pattern Watch: Price has broken below the uptrend support zone, with the next few candles likely to confirm a breakdown or fake out.
Invalidation Zone: Reclaiming $117,500+ would invalidate immediate downside risk.
Downside Confirmation: Sustained move below $115,500 may open downside targets near $112,000–$110,000.
This is a crucial technical juncture. Traders should watch for volume spikes and price reaction to confirm direction. A breakout or breakdown from this triangle will likely define Bitcoin's next multi-thousand-dollar move.
Declinazione di responsabilità
The information and publications are not meant to be, and do not constitute, financial, investment, trading, or other types of advice or recommendations supplied or endorsed by TradingView. Read more in the Terms of Use.
Declinazione di responsabilità
The information and publications are not meant to be, and do not constitute, financial, investment, trading, or other types of advice or recommendations supplied or endorsed by TradingView. Read more in the Terms of Use.