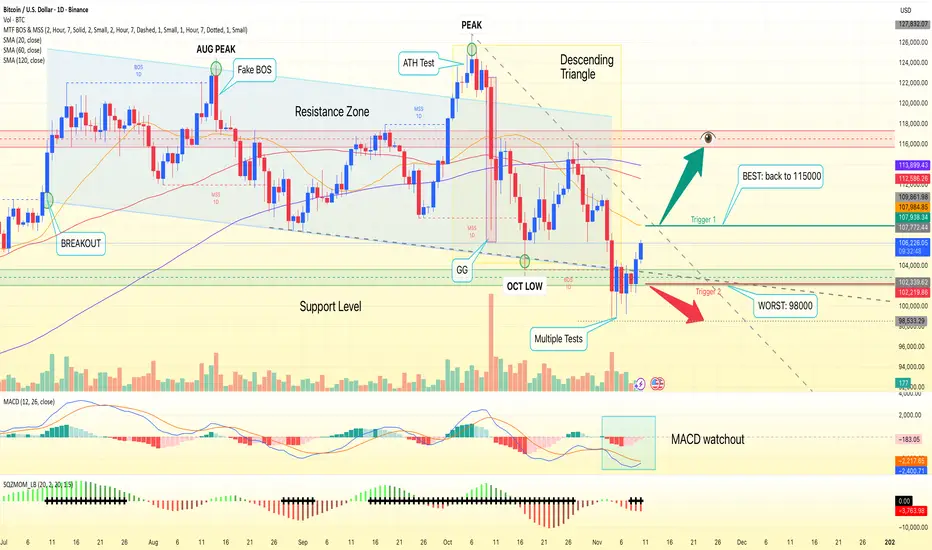
Bitcoin’s 1D chart remains in a downtrend from the $127,500 peak, with price capped beneath the 20/60/120-day MAs and volatility compressing. Structure is a clean descending triangle: a horizontal base at $102,500 and a series of lower highs, with $110,000 acting as near-term supply. After a brief undercut, price is attempting to recover, but the moving-average cluster between ~$108,000 and $114,000 still forms a heavy ceiling.
Primary path: sellers defend $108,000–$110,000 and force a fresh breakdown through the $102,500 floor. A daily close below $102,400—or more decisively, a break-and-hold under $102,000—would confirm continuation, opening the psychological $100,000 handle, then $98,400. That aligns with the triangle’s bearish follow-through and the still-subzero MACD despite fading downside momentum.
Alternative: if buyers reclaim resistance, a daily close above $114,000 would signal a structural shift and invite a squeeze toward $114,500 and the prior range high near $115,000. Aggressive bulls can look for an early momentum trigger on a daily close above $108,100, but expect chop into the MA cluster. For positioning, longs are invalidated on a sustained move below $100,000, while shorts are invalidated on a close above $115,000.
This is a study, not financial advice. Manage risk and invalidations
Nota
🎁 Please hit the like button and🎁 Leave a comment to support my work!
follow my X 👉 x.com/bbqgio
🔥 level up your Stock, FX, & Crypto: VIP access to AI technical analysis and pro market insights at TradeOS + 80%-off promo code 'EARLY' 👉
ai.tradeos.xyz/?utm_source=tvbg
🔥 level up your Stock, FX, & Crypto: VIP access to AI technical analysis and pro market insights at TradeOS + 80%-off promo code 'EARLY' 👉
ai.tradeos.xyz/?utm_source=tvbg
Declinazione di responsabilità
Le informazioni e le pubblicazioni non sono intese come, e non costituiscono, consulenza o raccomandazioni finanziarie, di investimento, di trading o di altro tipo fornite o approvate da TradingView. Per ulteriori informazioni, consultare i Termini di utilizzo.