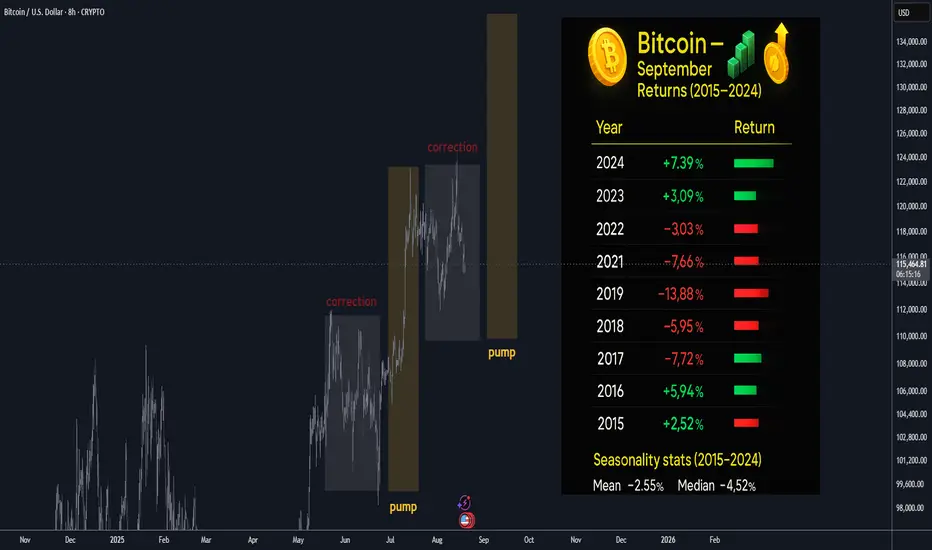
Bitcoin is heading into September after recently printing a new ATH,
historically September is a red month, so expecting further mild losses
heading into September and limited upside, however, once the pattern
and correction is complete, we should see another bull run and mark up.
📊 Bitcoin September Seasonality (Last 10 Years: 2015–2024)
Yearly September Returns
Year 📈 Return
2024 🟢 +7.39%
2023 🟢 +3.99%
2022 🔴 −3.09%
2021 🔴 −7.03%
2020 🔴 −7.66%
2019 🔴 −13.88%
2018 🔴 −5.95%
2017 🔴 −7.72%
2016 🟢 +5.94%
2015 🟢 +2.52%
📌 At-a-glance stats (2015–2024)
📉 Mean (10-yr): −2.55%
⚖️ Median: −4.52%
🔴 Red months: 6 out of 10
❌ Worst September: 2019 (−13.88%)
✅ Best September: 2024 (+7.39%)
📅 Recent Performance (last 3 years)
2024: 🟢 +7.39% → Strongest September in a decade
2023: 🟢 +3.99% → Rare green month, breaking the red-seasonality myth
2022: 🔴 −3.09% → Modest dip during a bearish macro cycle
➡️ Average of last 3 years: 🟢 +2.8%
➡️ Average of last 5 years (2020–2024): 🔴 −1.3%
🔎 Key Insights
September Slump : Historically, September is known as a "red month" for Bitcoin, often averaging −4% to −6% declines. Over the last decade, the median return (−4.5%) aligns with this bearish narrative.
Volatility Factor: The spread between best (+7.39% in 2024) and worst (−13.88% in 2019) September is 21 percentage points, underlining Bitcoin’s volatility even within seasonal patterns.
Changing Trend? The last two years (2023 & 2024) both closed green — suggesting the September slump might be losing strength in the current cycle.
🚀 Macro & Market Context
2019–2020: Heavy red Septembers coincided with global macro uncertainty (trade wars, COVID jitters).
2021: Correction phase post-$64k BTC ATH saw September hit −7%.
2022: Ongoing bear market after Terra/LUNA & 3AC collapses kept September negative.
2023–2024: Renewed momentum, institutional inflows, and ETF speculation helped reverse September’s red streak.
🧭 Takeaway
While September has historically been Bitcoin’s weakest month, the last two years show signs of reversal. The broader trend reminds us that seasonality is a tendency, not a guarantee — macro cycles and catalysts often override calendar effects.
Nota
Blueprint to Becoming a Successful Gold Trader in 2025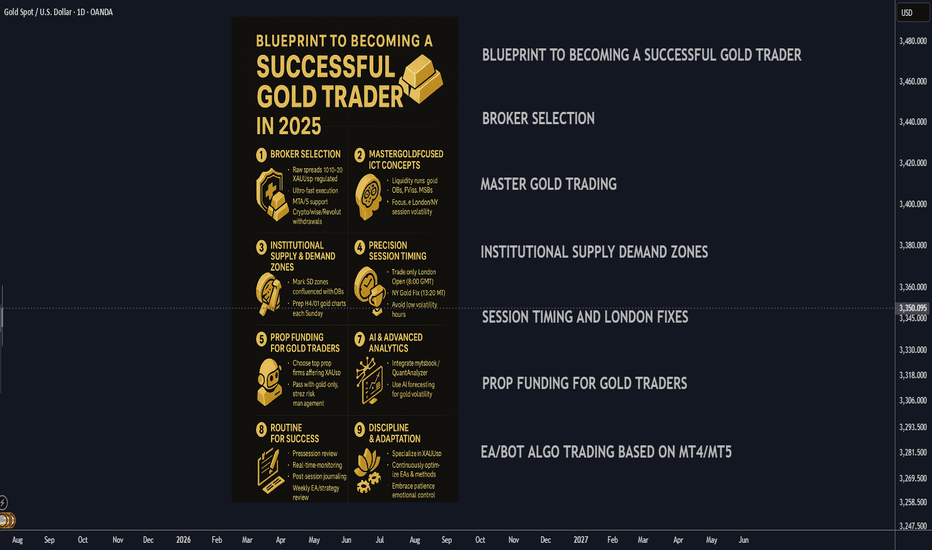
Nota
DAX/GER30 SHORT/LONG sequence Swing Trade +500/+500 points
Nota
3 Actionable FX Strategies — With Real Trade Examples
Nota
Gold Prices Overview of Primary Catalyst : September 2025
Nota
Dogecoin (DOGE) Market Update & Catalysts: Ready for 50 cents?
Nota
Ferrari (RACE) Catalyst Scorecard AND 2026 Outlook
taplink.cc/black001
🔱Syndicate Black MT4/MT5
⚡️Gold/FX Auto-Trading bot
🔱100%/week max DD <5%
📕verified 1800%+ gains
🏧GOLD EA target 100%+ gains/week
🚀supercharge your trading
💎75% win rate gold signals
t.me/syndicategold001
🔱Syndicate Black MT4/MT5
⚡️Gold/FX Auto-Trading bot
🔱100%/week max DD <5%
📕verified 1800%+ gains
🏧GOLD EA target 100%+ gains/week
🚀supercharge your trading
💎75% win rate gold signals
t.me/syndicategold001
Declinazione di responsabilità
Le informazioni e le pubblicazioni non sono intese come, e non costituiscono, consulenza o raccomandazioni finanziarie, di investimento, di trading o di altro tipo fornite o approvate da TradingView. Per ulteriori informazioni, consultare i Termini di utilizzo.