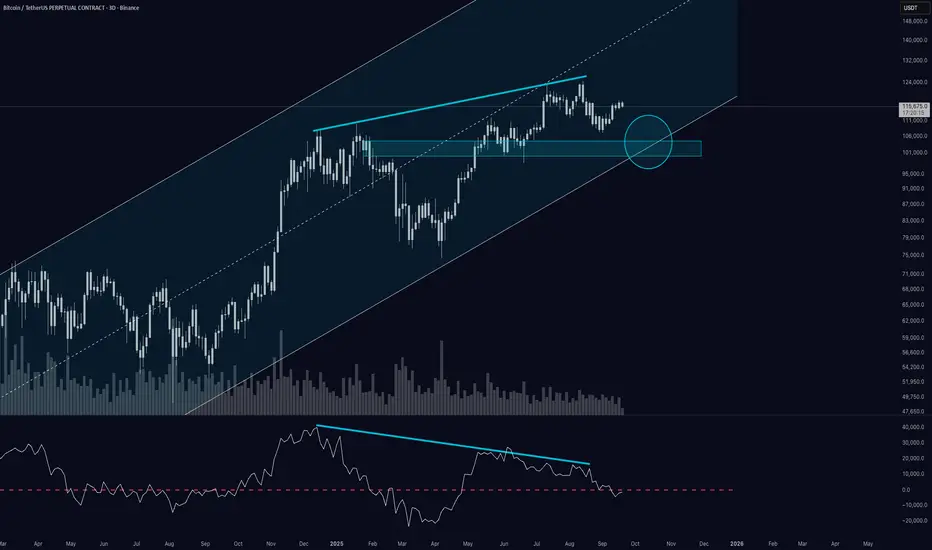
On the 3-day chart, Bitcoin continues to respect its long-term ascending channel, with both the upper and lower boundaries acting as clean structural guides.
🔹 Momentum: After months of strength, momentum has slipped below the 0-line and is currently retesting it – a key pivot that often defines whether trend continuation or correction follows.
🔹 Structure: The lower boundary of the channel lines up almost perfectly with the horizontal support zone built from previous highs (around 100k–103k). This confluence makes it a natural candidate for a pullback area.
🔹 Volume: A noteworthy observation is the declining volume profile during the most recent leg higher – a potential early warning that participation is fading.
If the 100k–103k support area holds, the long-term uptrend remains intact.
But a decisive breakdown could open the door to a deeper correction.
👉 What do you think – is Bitcoin gearing up for another strong bounce off the channel, or are we on the edge of a deeper retracement?
Let’s discuss in the comments.
Disclaimer: This is a market observation, not financial advice.
Declinazione di responsabilità
Le informazioni e le pubblicazioni non sono intese come, e non costituiscono, consulenza o raccomandazioni finanziarie, di investimento, di trading o di altro tipo fornite o approvate da TradingView. Per ulteriori informazioni, consultare i Termini di utilizzo.
Declinazione di responsabilità
Le informazioni e le pubblicazioni non sono intese come, e non costituiscono, consulenza o raccomandazioni finanziarie, di investimento, di trading o di altro tipo fornite o approvate da TradingView. Per ulteriori informazioni, consultare i Termini di utilizzo.