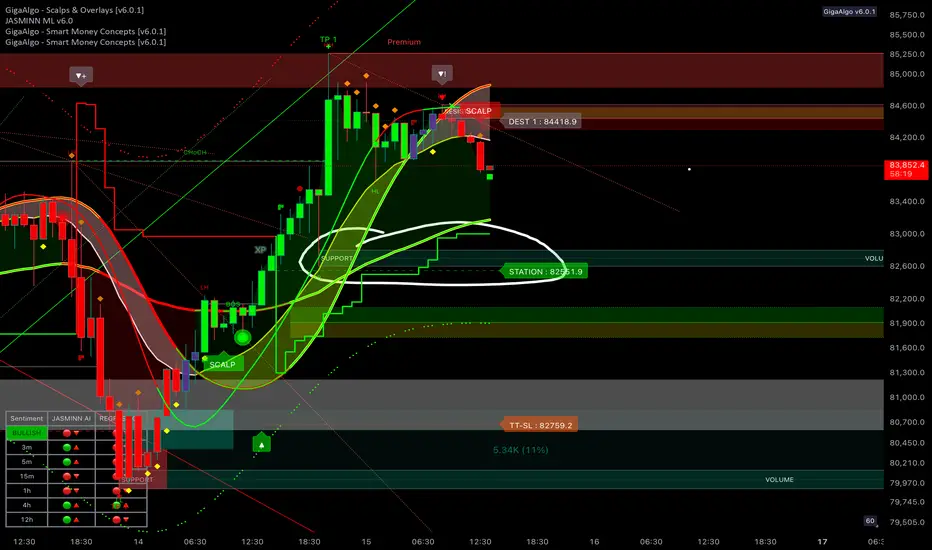
Bitcoin is currently in a pullback phase after reaching a local high, showing signs of short-term weakness. The price action reflects a clear upward trend supported by higher lows and strong buyer interest, but recent rejection at a resistance zone indicates profit-taking and potential short-term selling pressure.
A key support zone lies below the current price level, marked by increasing volume and a station level where buyers are likely to step in. If the price holds this support, a continuation of the bullish trend could follow, targeting the previous resistance zone. However, if the support fails, a deeper correction toward lower demand levels is possible.
Market sentiment is mixed — short-term signals show bullish strength, while higher timeframes remain cautious. The next key move depends on whether buyers defend the support zone and push through the overhead resistance. A confirmed breakout above resistance could drive the next upward leg, while a breakdown below support could shift momentum back to the bears.
Pubblicazioni correlate
Declinazione di responsabilità
Le informazioni e le pubblicazioni non sono intese come, e non costituiscono, consulenza o raccomandazioni finanziarie, di investimento, di trading o di altro tipo fornite o approvate da TradingView. Per ulteriori informazioni, consultare i Termini di utilizzo.