Danger Ahead? Bearish Signal Spotted on the Daily Timeframe!
Price Action Analysis (Daily & Intraday)
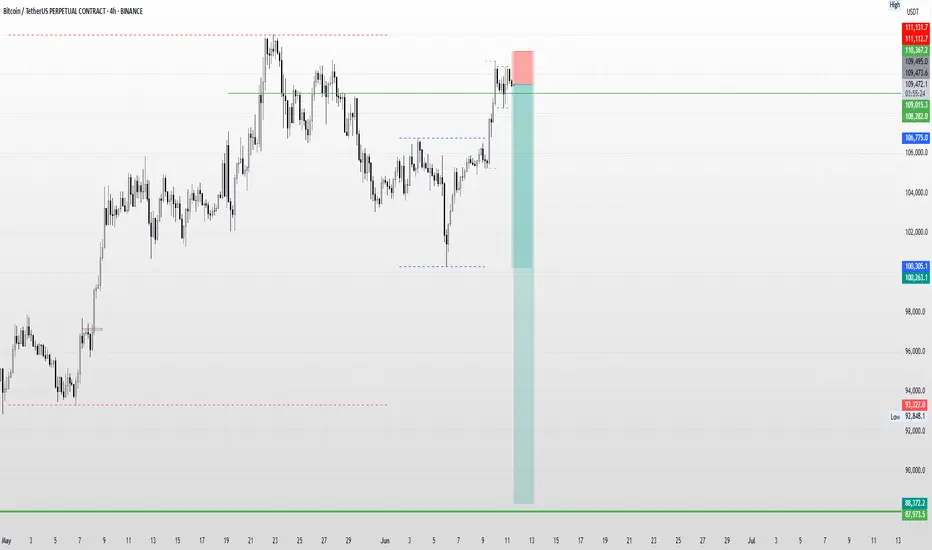
A bearish pattern has formed on the Daily Timeframe, and early signs of execution are visible on the 1-hour chart, indicating a potential Double Top formation. If confirmed, the price may drop with an initial target around 100263. Should the bearish momentum continue, the next significant weekly support could be tested near 88372.
Caution:
This setup is considered risky, primarily because the higher timeframe (Monthly) still shows an overall uptrend. However, with a well-defined stop-loss above 16367 and proper risk management, the trade could offer a favorable risk-to-reward ratio.
Disclaimer:
Trading, especially in futures and options, involves a high degree of risk. Losses can exceed capital if not managed properly. This is not financial advice. Please do your own analysis or consult a certified financial advisor before making any investment decisions.
Declinazione di responsabilità
Le informazioni e le pubblicazioni non sono intese come, e non costituiscono, consulenza o raccomandazioni finanziarie, di investimento, di trading o di altro tipo fornite o approvate da TradingView. Per ulteriori informazioni, consultare i Termini di utilizzo.
Declinazione di responsabilità
Le informazioni e le pubblicazioni non sono intese come, e non costituiscono, consulenza o raccomandazioni finanziarie, di investimento, di trading o di altro tipo fornite o approvate da TradingView. Per ulteriori informazioni, consultare i Termini di utilizzo.