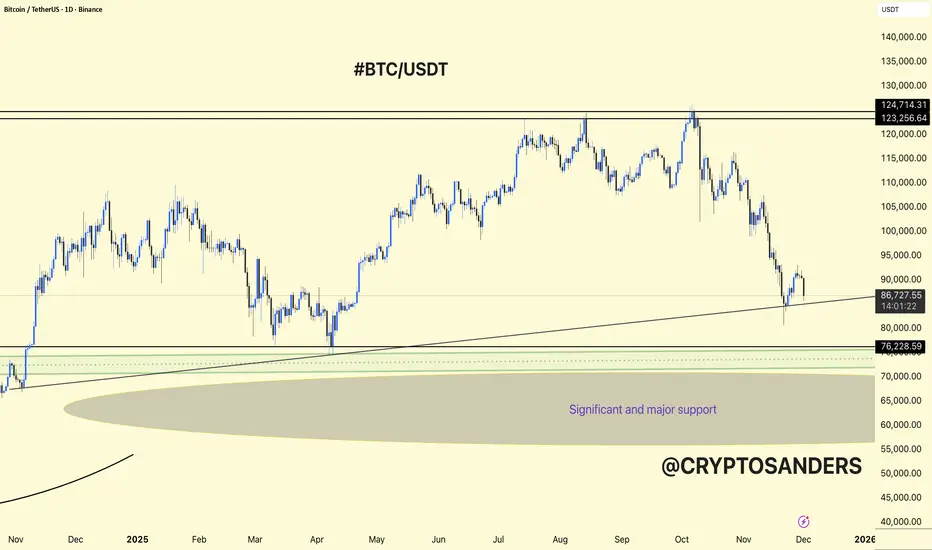
BTCUSDT is in a corrective phase on the 1D chart, but it is still sitting above a major higher-timeframe support zone.
The chart shows a long-term ascending trendline from late 2024 to early 2025 that currently intersects just below the price, acting as dynamic support together with the horizontal 80k–82k area.
Below that, the wider “significant and major support” region lies roughly between 70k and 65k, which is the last strong demand block if 80k breaks.
Bullish case: Holding above the trendline and 80k–82k could form a higher low; from there BTCUSDT can attempt a recovery toward 95k–100k and eventually back to the 120k+ resistance, but it needs clear higher highs and higher lows on the daily to confirm.
Bearish case: A clean daily close below the trendline and 80k support opens room for a deeper flush into the 70k–65k major support zone, where a larger accumulation base may form before any new up‑leg.
DYOR | NFA
Pubblicazioni correlate
Declinazione di responsabilità
Le informazioni e le pubblicazioni non sono intese come, e non costituiscono, consulenza o raccomandazioni finanziarie, di investimento, di trading o di altro tipo fornite o approvate da TradingView. Per ulteriori informazioni, consultare i Termini di utilizzo.