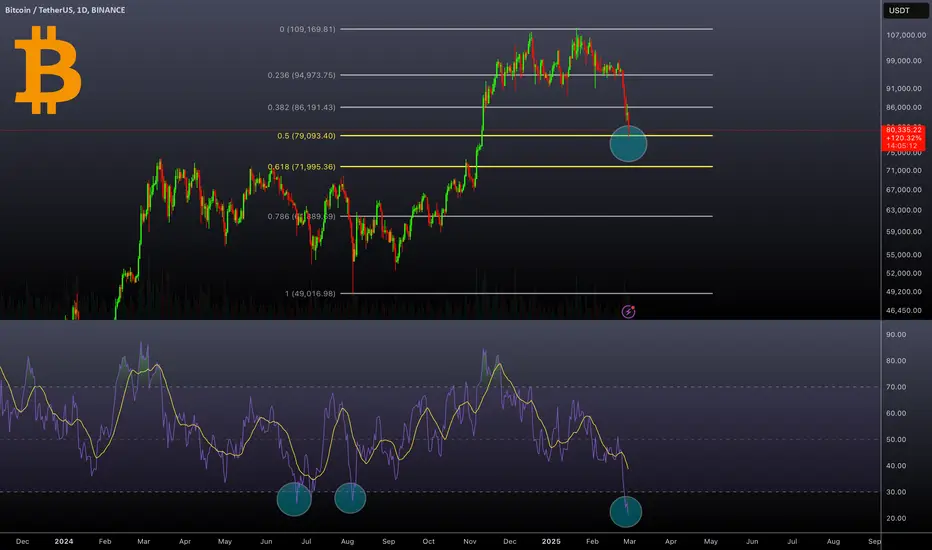
Bitcoin's daily chart shows a significant price retracement, currently testing the key 0.5 Fibonacci level around $79,000. This level historically acts as a strong support zone during corrective phases. If BTC holds above this level, it could signal a potential rebound. However, if it breaks lower, the next major support is near $72,000 (0.618 Fibonacci level).
Additionally, the Relative Strength Index (RSI) has dropped to the 20 level, indicating extreme oversold conditions. Historically, such low RSI readings have led to strong reversals. If buying pressure emerges, BTC could see a recovery from these levels.
Regards
Hexa
Additionally, the Relative Strength Index (RSI) has dropped to the 20 level, indicating extreme oversold conditions. Historically, such low RSI readings have led to strong reversals. If buying pressure emerges, BTC could see a recovery from these levels.
Regards
Hexa
🚀Telegram : t.me/hexatrades
🌐Website: hexatrades.io/
🗣️Twitter(X): twitter.com/HexaTrades
🌐Website: hexatrades.io/
🗣️Twitter(X): twitter.com/HexaTrades
Pubblicazioni correlate
Declinazione di responsabilità
Le informazioni ed i contenuti pubblicati non costituiscono in alcun modo una sollecitazione ad investire o ad operare nei mercati finanziari. Non sono inoltre fornite o supportate da TradingView. Maggiori dettagli nelle Condizioni d'uso.