BTC/USDT RSI Analysis
RSI (Relative Strength Index) breakout analysis.
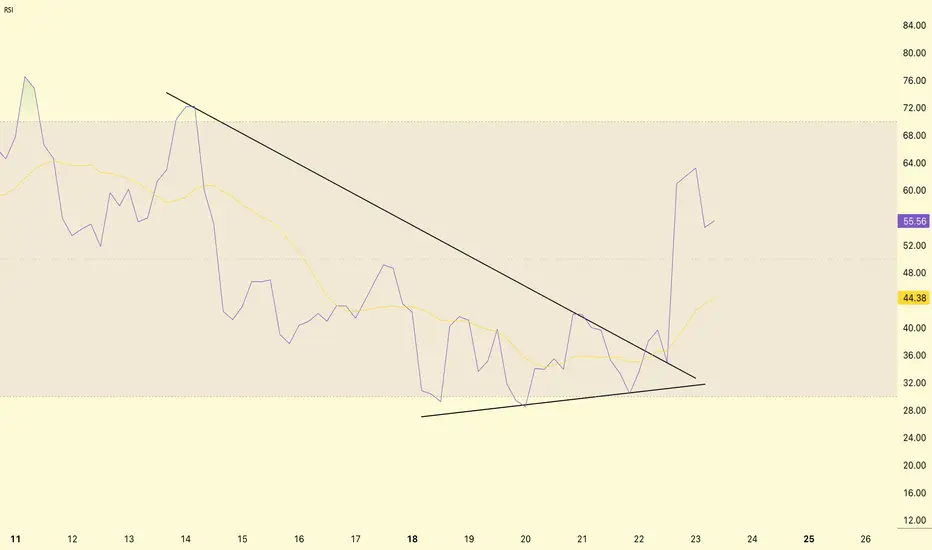
Descending wedge in RSI
From August 11 to August 22, RSI was forming a descending wedge pattern (lower high, higher low).
This is usually a bullish reversal setup.
RSI breakout
RSI broke out of the bullish wedge on August 22 → rose from ~30 to ~65.
Current RSI = 55.97 → from neutral to bullish territory.
Moving average (yellow line) = 44.41, which means RSI is above the trend, indicating positive momentum.
RSI breakout confirms strong buying interest.
This could mean that BTC has completed its short-term correction phase and is ready for another rise.
DYOR | NFA
RSI (Relative Strength Index) breakout analysis.
Descending wedge in RSI
From August 11 to August 22, RSI was forming a descending wedge pattern (lower high, higher low).
This is usually a bullish reversal setup.
RSI breakout
RSI broke out of the bullish wedge on August 22 → rose from ~30 to ~65.
Current RSI = 55.97 → from neutral to bullish territory.
Moving average (yellow line) = 44.41, which means RSI is above the trend, indicating positive momentum.
RSI breakout confirms strong buying interest.
This could mean that BTC has completed its short-term correction phase and is ready for another rise.
DYOR | NFA
Pubblicazioni correlate
Declinazione di responsabilità
Le informazioni ed i contenuti pubblicati non costituiscono in alcun modo una sollecitazione ad investire o ad operare nei mercati finanziari. Non sono inoltre fornite o supportate da TradingView. Maggiori dettagli nelle Condizioni d'uso.
Pubblicazioni correlate
Declinazione di responsabilità
Le informazioni ed i contenuti pubblicati non costituiscono in alcun modo una sollecitazione ad investire o ad operare nei mercati finanziari. Non sono inoltre fornite o supportate da TradingView. Maggiori dettagli nelle Condizioni d'uso.