Pair: 
 BTCUSDT
Timeframes: 1D context, 4H execution
Type: Educational market study
Thesis
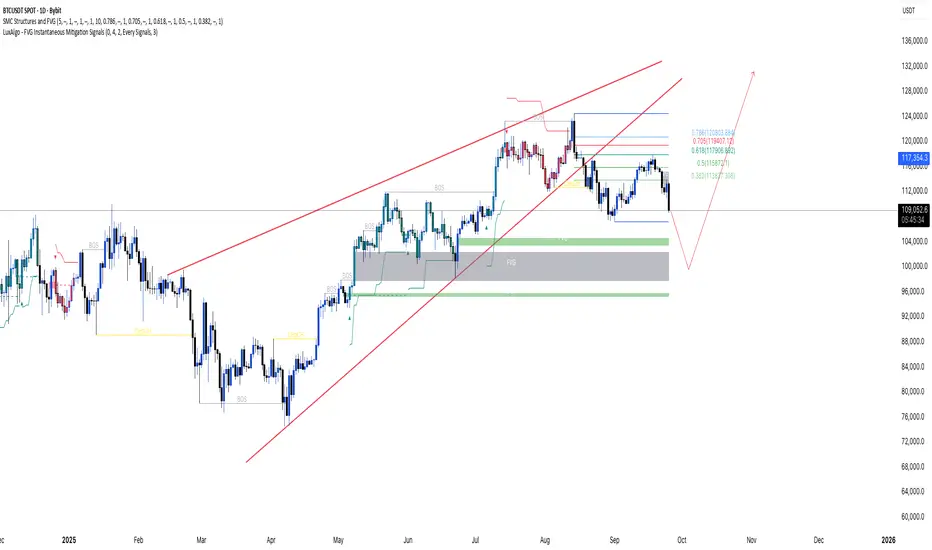
After printing a rising-wedge into ATH and breaking down, price is in a corrective leg within a higher-timeframe uptrend. I’m watching for a controlled pullback toward 107–106k A deeper flush could reach the D1 imbalance/demand around 101–104k, with a max-draw scenario toward 98K, If today’s daily close reclaims 111K, the near-term bounce path opens toward 115k, aligning with the 0.5–0.618 retracement cluster.
Market structure & SMC read
* Trend: HTF uptrend intact on D1/W1; local distribution after ATH.
* Pattern: Rising wedge into ATH, then breakdown and retest of the lower boundary.
* BOS/CHOCH: Most recent BOS occurred on the run to ATH; current move is corrective.
Supply/Demand:
Shallow demand: 106–107k.
Primary D1 demand/FVG: 101–104k.
* Liquidity: Resting liquidity sits below recent equal lows at 106–107k and deeper toward 98–100k. Overhead liquidity and confluence cluster around 113.9k / 115.8k / 117.9k / 119.4k / 120.8k (Fib 0.382→0.786).
Key levels
* Supports: 107.0k, 106.0k, 101–104k FVG, 98.0k.
* Reclaim gate:111k(daily close).
* Fib/targets: 0.382 -113.9k, 0.5 -115.8k, 0.618- 117.9k, 0.705-119.4k, 0.786 -120.8.
Scenarios
A) Base case: Dip then bounce
1. Sweep into 107–106k to clear local lows.
2. LTF **CHOCH/BOS** back above 107.5k with absorption tails.
3. Path: 111k reclaim → 113.9k** → 115.8k; stretch 117.9k.
B) Deeper flush: FVG mitigation
1. Failure to hold 106k on a D1 close opens 101–104k demand/FVG fill.
2. LTF confirmation from that block targets 109–111k first, then the Fib cluster.
3. 98k is the outer guardrail; a daily close below weakens the broader bullish case.
C) Immediate reclaim: Momentum continuation
* A daily close above 111k without tagging 106k first suggests strong demand. Look for follow-through toward **115.8k**, monitor reactions at 117.9k–120.8k.
Trigger criteria (educational, not signals)
* Price action: Liquidity sweep of 106–107k followed by LTF CHOCH/BOS back into structure.
* Volume:** Effort vs. result divergence on the dip or visible absorption at demand.
* Indicators (optional): RSI failure swing on LTF, session VWAPreclaim, MA(20/50) compression then expansion on the reversal impulse.
Risk framing (hypothetical)
* Define risk below the swept swing if engaging 106–107k; wider risk below 101k if waiting for the FVG fill.
* Initial R:R around 1:2 into 111k; scale at 113.9k, leave runner toward 115.8k.
Seasonal context
September often delivers corrective flows; Q4 has historically skewed bullish. This view aligns with a September pullback resolving into Q4 continuation, provided 98–101k remains protected on daily closes.
Chart notes
* Rising wedge into ATH, breakdown and retest
* D1 demand/FVG 101–104k and shallow demand 106–107k
* Fibonacci confluence 113.9k → 120.8k
Disclaimer: This is an educational market study, not financial advice. Do your own research and risk management.
Timeframes: 1D context, 4H execution
Type: Educational market study
Thesis
After printing a rising-wedge into ATH and breaking down, price is in a corrective leg within a higher-timeframe uptrend. I’m watching for a controlled pullback toward 107–106k A deeper flush could reach the D1 imbalance/demand around 101–104k, with a max-draw scenario toward 98K, If today’s daily close reclaims 111K, the near-term bounce path opens toward 115k, aligning with the 0.5–0.618 retracement cluster.
Market structure & SMC read
* Trend: HTF uptrend intact on D1/W1; local distribution after ATH.
* Pattern: Rising wedge into ATH, then breakdown and retest of the lower boundary.
* BOS/CHOCH: Most recent BOS occurred on the run to ATH; current move is corrective.
Supply/Demand:
Shallow demand: 106–107k.
Primary D1 demand/FVG: 101–104k.
* Liquidity: Resting liquidity sits below recent equal lows at 106–107k and deeper toward 98–100k. Overhead liquidity and confluence cluster around 113.9k / 115.8k / 117.9k / 119.4k / 120.8k (Fib 0.382→0.786).
Key levels
* Supports: 107.0k, 106.0k, 101–104k FVG, 98.0k.
* Reclaim gate:111k(daily close).
* Fib/targets: 0.382 -113.9k, 0.5 -115.8k, 0.618- 117.9k, 0.705-119.4k, 0.786 -120.8.
Scenarios
A) Base case: Dip then bounce
1. Sweep into 107–106k to clear local lows.
2. LTF **CHOCH/BOS** back above 107.5k with absorption tails.
3. Path: 111k reclaim → 113.9k** → 115.8k; stretch 117.9k.
B) Deeper flush: FVG mitigation
1. Failure to hold 106k on a D1 close opens 101–104k demand/FVG fill.
2. LTF confirmation from that block targets 109–111k first, then the Fib cluster.
3. 98k is the outer guardrail; a daily close below weakens the broader bullish case.
C) Immediate reclaim: Momentum continuation
* A daily close above 111k without tagging 106k first suggests strong demand. Look for follow-through toward **115.8k**, monitor reactions at 117.9k–120.8k.
Trigger criteria (educational, not signals)
* Price action: Liquidity sweep of 106–107k followed by LTF CHOCH/BOS back into structure.
* Volume:** Effort vs. result divergence on the dip or visible absorption at demand.
* Indicators (optional): RSI failure swing on LTF, session VWAPreclaim, MA(20/50) compression then expansion on the reversal impulse.
Risk framing (hypothetical)
* Define risk below the swept swing if engaging 106–107k; wider risk below 101k if waiting for the FVG fill.
* Initial R:R around 1:2 into 111k; scale at 113.9k, leave runner toward 115.8k.
Seasonal context
September often delivers corrective flows; Q4 has historically skewed bullish. This view aligns with a September pullback resolving into Q4 continuation, provided 98–101k remains protected on daily closes.
Chart notes
* Rising wedge into ATH, breakdown and retest
* D1 demand/FVG 101–104k and shallow demand 106–107k
* Fibonacci confluence 113.9k → 120.8k
Disclaimer: This is an educational market study, not financial advice. Do your own research and risk management.
Declinazione di responsabilità
Le informazioni ed i contenuti pubblicati non costituiscono in alcun modo una sollecitazione ad investire o ad operare nei mercati finanziari. Non sono inoltre fornite o supportate da TradingView. Maggiori dettagli nelle Condizioni d'uso.
Declinazione di responsabilità
Le informazioni ed i contenuti pubblicati non costituiscono in alcun modo una sollecitazione ad investire o ad operare nei mercati finanziari. Non sono inoltre fornite o supportate da TradingView. Maggiori dettagli nelle Condizioni d'uso.