📊 Chart Explanation: BTC/USDT (4H, Bybit)
🟢 Current Situation:
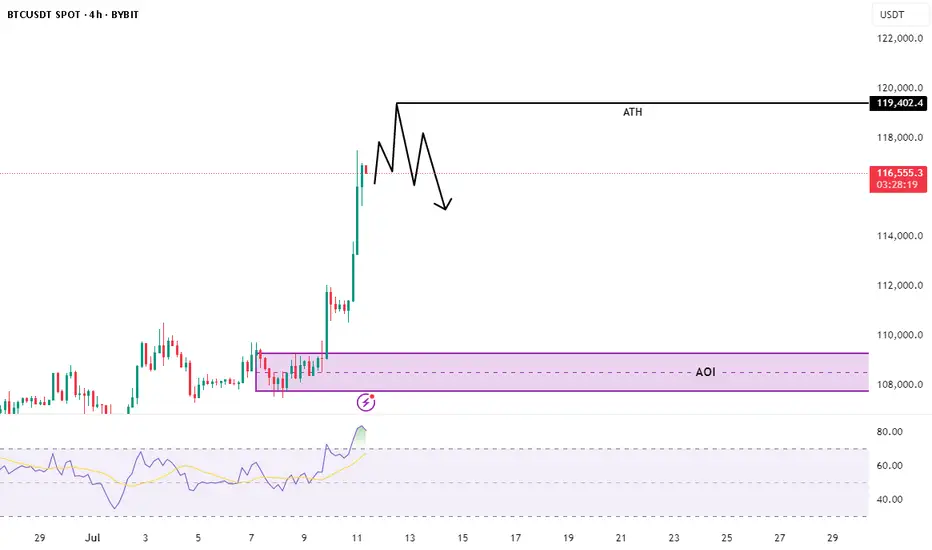
BTC is pushing toward its All-Time High (ATH) level at $119,402.
We've seen a strong vertical rally with minimal pullbacks — classic "euphoria phase" behavior.
Price is currently around $116,500, getting close to major resistance.
⚠️ Key Observation – Bearish Divergence:
The Relative Strength Index (RSI) is showing bearish divergence:
Price is making higher highs
RSI is making lower highs
This signals momentum weakening, despite price moving up — a possible reversal warning.
🚫 Why No Trade (Yet):
You're not entering a position now because:
Price is near ATH — a major liquidity area where fakeouts are common
You expect a potential rejection or liquidity sweep near ATH
No confirmed reversal or entry trigger yet
🟣 What You're Watching:
The AOI (Area of Interest) marked around $108,000–$110,000
This is likely a previous consolidation or demand zone
If price retraces and gives a clean setup (e.g., bullish structure, volume, RSI reset), then you may consider a long entry
🔍 Summary:
You're being patient and strategic, observing potential weakness in momentum . now 119.4k will be next ATH. In my point of view .
No trade now — waiting for confirmation or a pullback into your AOI zone.
👉 Follow me on X for real-time market updates & trade ideas! 👇
#BTC #Bitcoin #Crypto #Trading #TA #RSI #Divergence
🟢 Current Situation:
BTC is pushing toward its All-Time High (ATH) level at $119,402.
We've seen a strong vertical rally with minimal pullbacks — classic "euphoria phase" behavior.
Price is currently around $116,500, getting close to major resistance.
⚠️ Key Observation – Bearish Divergence:
The Relative Strength Index (RSI) is showing bearish divergence:
Price is making higher highs
RSI is making lower highs
This signals momentum weakening, despite price moving up — a possible reversal warning.
🚫 Why No Trade (Yet):
You're not entering a position now because:
Price is near ATH — a major liquidity area where fakeouts are common
You expect a potential rejection or liquidity sweep near ATH
No confirmed reversal or entry trigger yet
🟣 What You're Watching:
The AOI (Area of Interest) marked around $108,000–$110,000
This is likely a previous consolidation or demand zone
If price retraces and gives a clean setup (e.g., bullish structure, volume, RSI reset), then you may consider a long entry
🔍 Summary:
You're being patient and strategic, observing potential weakness in momentum . now 119.4k will be next ATH. In my point of view .
No trade now — waiting for confirmation or a pullback into your AOI zone.
👉 Follow me on X for real-time market updates & trade ideas! 👇
#BTC #Bitcoin #Crypto #Trading #TA #RSI #Divergence
Declinazione di responsabilità
Le informazioni ed i contenuti pubblicati non costituiscono in alcun modo una sollecitazione ad investire o ad operare nei mercati finanziari. Non sono inoltre fornite o supportate da TradingView. Maggiori dettagli nelle Condizioni d'uso.
Declinazione di responsabilità
Le informazioni ed i contenuti pubblicati non costituiscono in alcun modo una sollecitazione ad investire o ad operare nei mercati finanziari. Non sono inoltre fornite o supportate da TradingView. Maggiori dettagli nelle Condizioni d'uso.